

Question: ne Insert Draw Page Layout Formulas Data Review View Automate Tell me Probability Density Function ( PDF ) Calculating the propability ( in Excel )
ne Insert Draw Page Layout Formulas Data Review View Automate Tell me
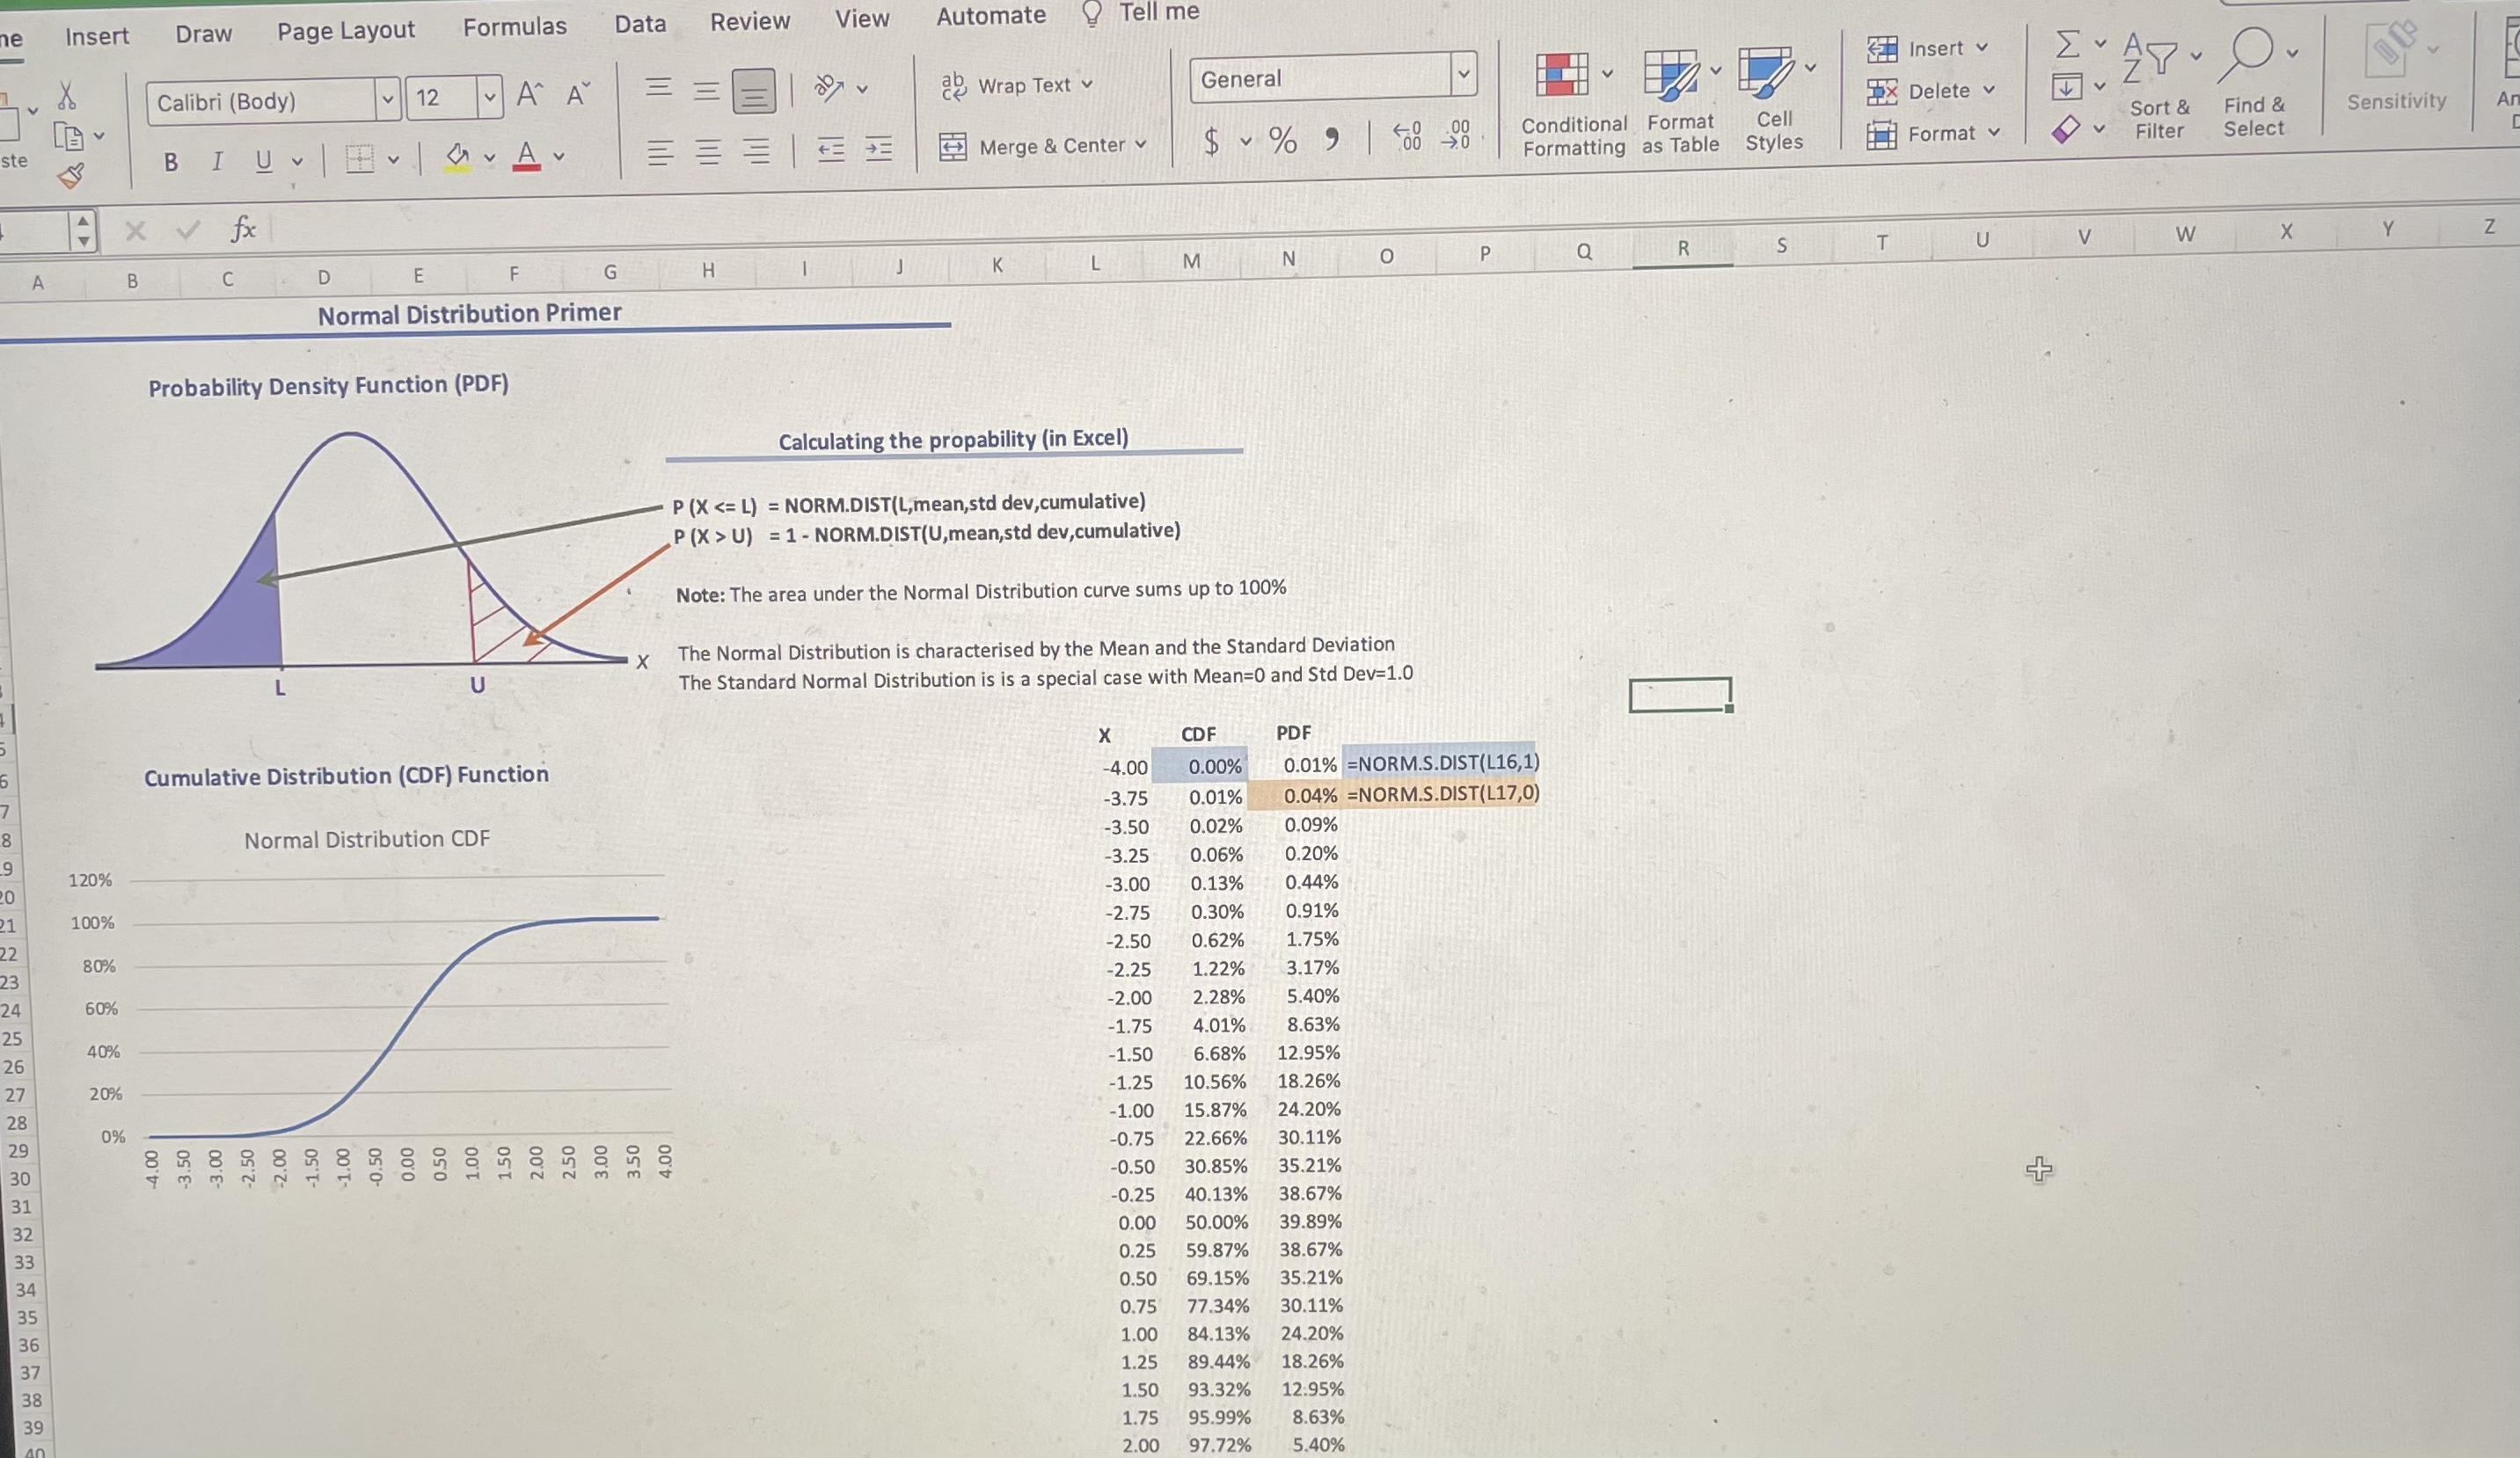
Probability Density Function PDF
Calculating the propability in Excel
NORM.DISTLmean,std dev,cumulative
NORM.DISTUmean,std dev,cumulative
Jte: The area under the Normal Distribution curve sums up to
Ie Normal Distribution is characterised by the Mean and the Standard Deviation
e Standard Normal Distribution is is a special case with Mean and Std Dev
Cumulative Distribution CDF Function
tableCDFPDF NORM.SDISTL NORM.SDISTL
Step by Step Solution
There are 3 Steps involved in it
1 Expert Approved Answer
Step: 1 Unlock

Question Has Been Solved by an Expert!
Get step-by-step solutions from verified subject matter experts
Step: 2 Unlock
Step: 3 Unlock