

Question: need a visual basic code, step by step, pictures, explanation would be helpful In this lab, you will create a graphing program that will allow
need a visual basic code, step by step, pictures, explanation would be helpful
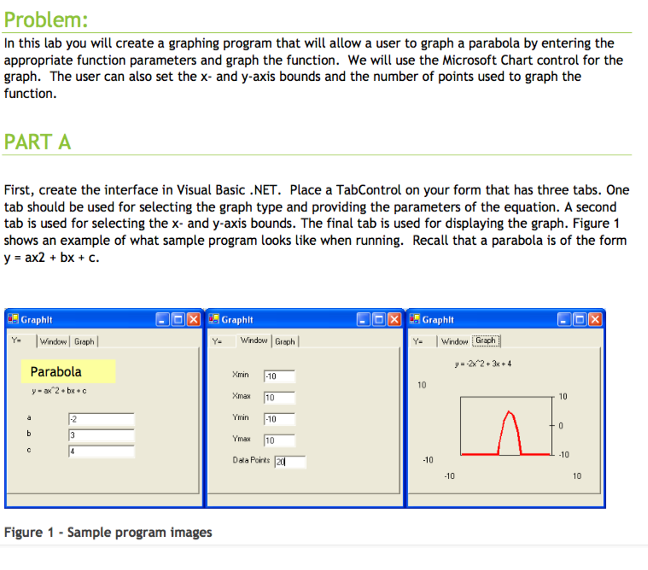
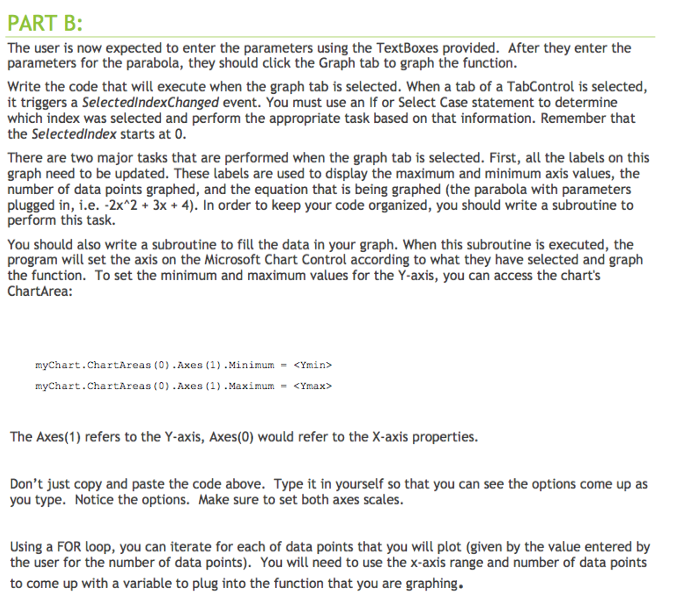
In this lab, you will create a graphing program that will allow a user to graph a parabola by entering the appropriate function parameters and graph the function. We will use the Microsoft Chart control for the graph. the user can also set the x- and y-axis bounds and the number of points used to graph the function. First, create the interface in Visual Basic .NET. Place a Tab Control on your form that has three tabs. One tab should be used for selecting the graph type and providing the parameters of the equation. A second tab is used for selecting the x- and y-axis bounds. the final tab is used for displaying the graph. Figure 1 shows an example of what sample program looks like when running. Recall that a parabola is of the form y = ax2 + bx + c. the user is now expected to enter the parameters using the Text Boxes provided. After they enter the parameters for the parabola, they should click the Graph tab to graph the function. Write the code that will execute when the graph tab is selected. When a tab of a Tab Control is selected, it triggers a Selected index Changed event. You must use an If or Select Case statement to determine which index was selected and perform the appropriate task based on that information. Remember that the Selected index starts at 0. There are two major tasks that are performed when the graph tab is selected. First, all the labels on this graph need to be updated. These labels are used to display the maximum and minimum axis values, the number of data points graphed, and the equation that is being graphed (the parabola with parameters plugged in, i.e. -2x^2 + 3x + 4). in order to keep your code organized, you should write a subroutine to perform this task. You should also write a subroutine to fill the data in your graph. When this subroutine is executed, the program will set the axis on the Microsoft Chart Control according to what they have selected and graph the function. To set the minimum and maximum values for the Y-axis, you can access the chart's Chart Area: myChart.ChartArea3 (0) .Axea (1) .Minimum -
Step by Step Solution
There are 3 Steps involved in it

Get step-by-step solutions from verified subject matter experts