

Question: Need help 11:54 AM Sat Sep 17 . . . @ 5% 11:54 AM c Sat sep 17 Ver Una Familia... Consider the m... ng.cengage.com
Need help

11:54 AM Sat Sep 17 . . . @ 5%
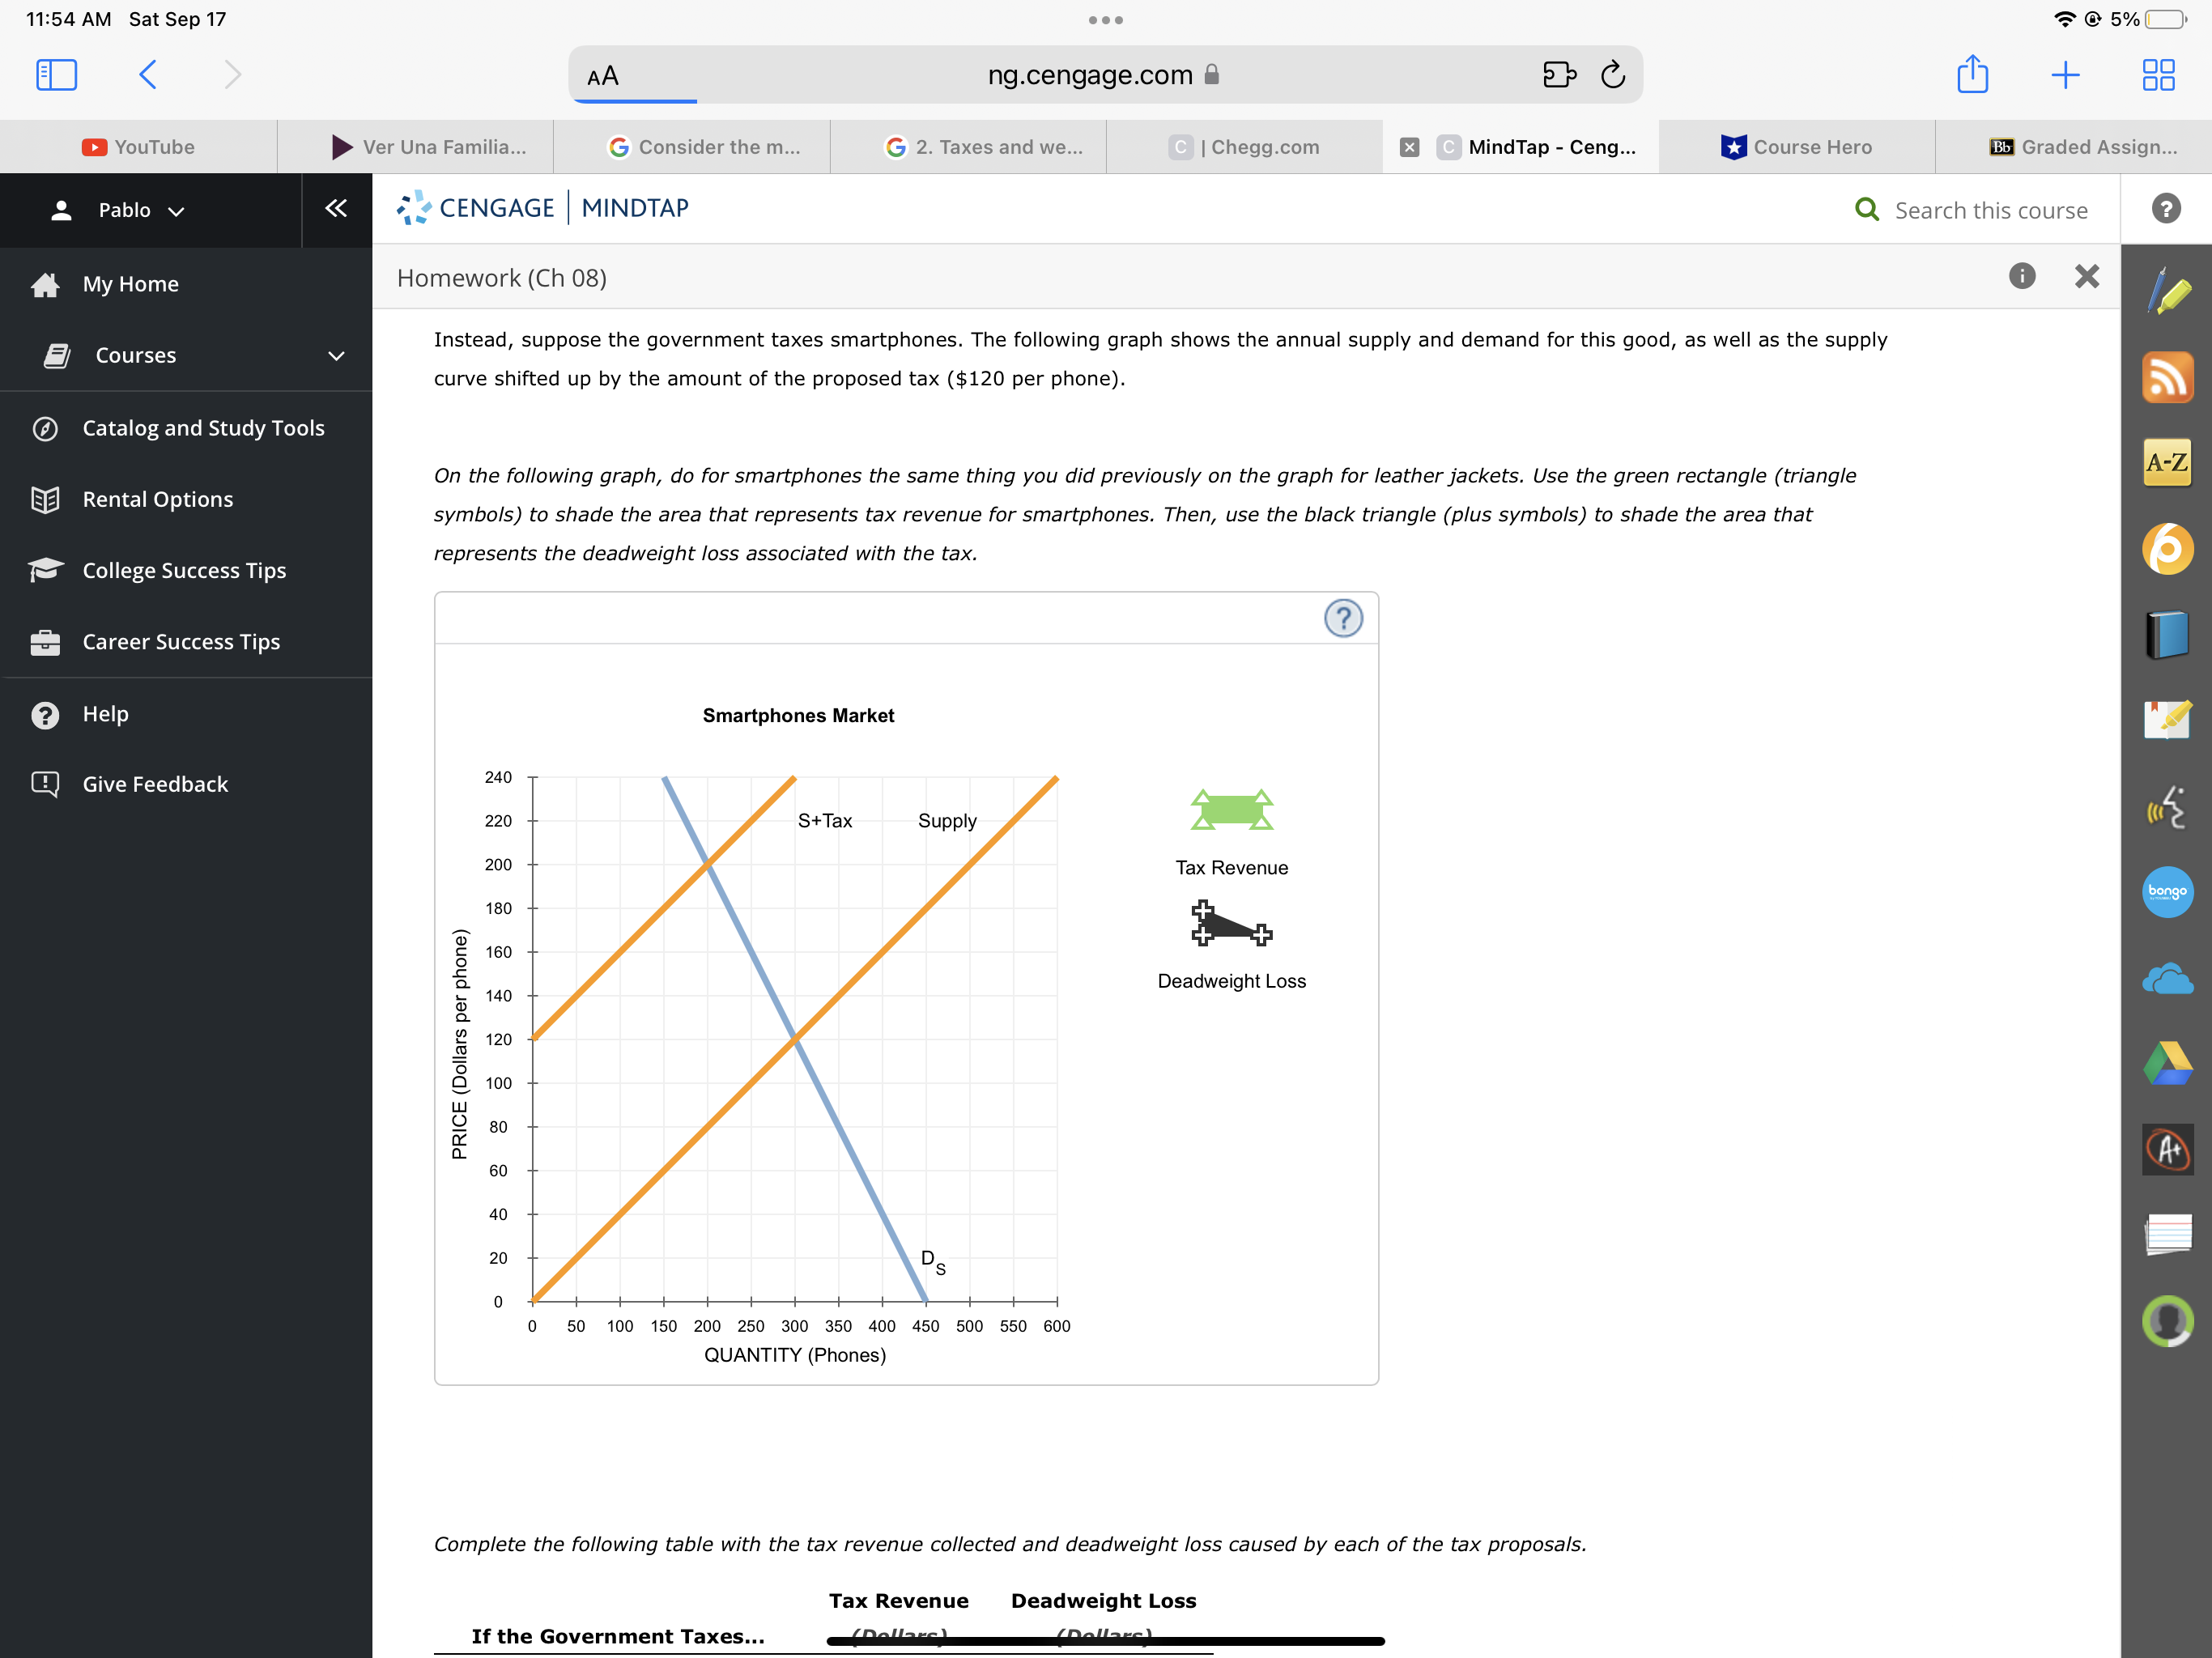
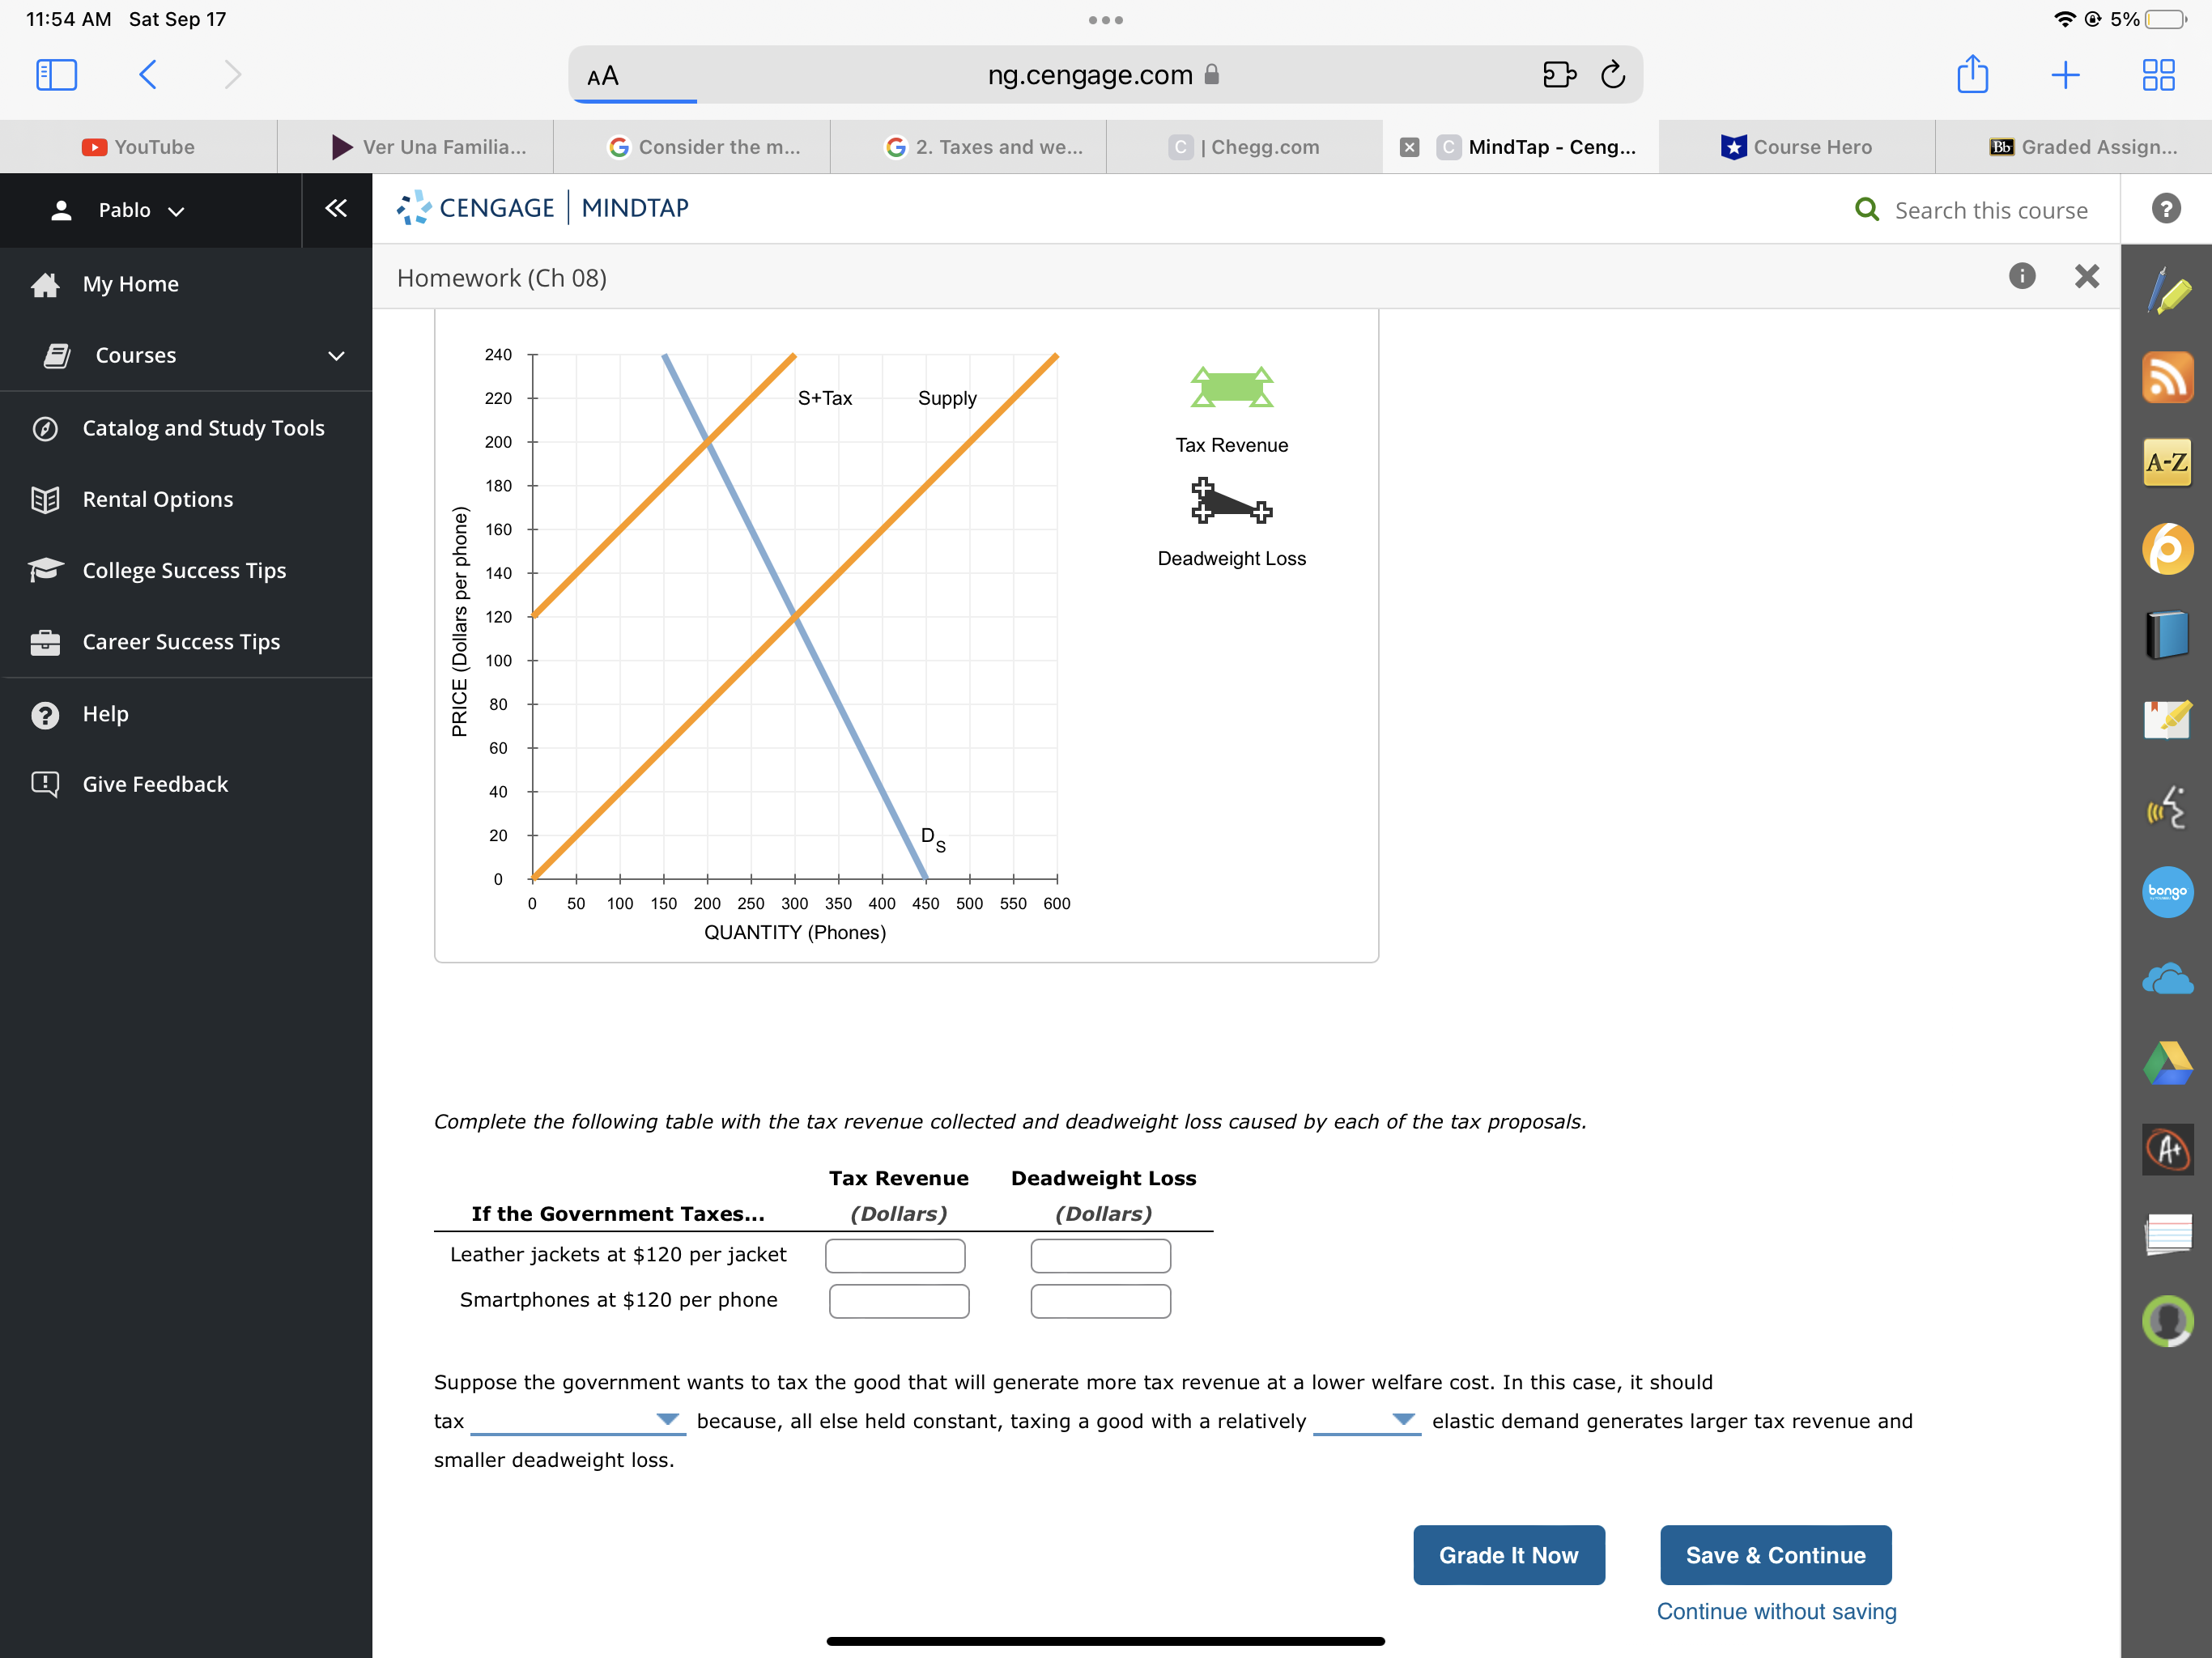
11:54 AM c Sat sep 17 Ver Una Familia... Consider the m... ng.cengage.com 2. Taxes and we... YouTube Pablo v My Home g,' Courses I Chegg.com MindTap - Ceng... Course Hero Q CENGAGE I MINDTAP Homework (Ch 08) Instead, suppose the government taxes smartphones. The following graph shows the annual supply and demand for this good, as well as the supply curve shifted up by the amount of the proposed tax ($120 per phone). On the following graph, do for smartphones the same thing you did previously on the graph for leather jackets. Use the green rectangle (triangle symbols) to shade the area that represents tax revenue for smartphones. Then, use the black triangle (plus symbols) to shade the area that represents the deadweight loss associated with the tax. 5% oo oo Graded Assign... Search this course A-Z CQ Catalog and Study Tools Rental Options College Success Tips Career Success Tips Help Give Feedback 0 240 220 200 180 160 140 120 100 80 60 40 20 o 50 Smartphones Market S+Tax 100 150 200 250 300 350 400 QUANTITY (Phones) Supply Tax Revenue Deadweight Loss s 450 500 550 600 Complete the following table with the tax revenue collected and deadweight loss caused by each of the tax proposals. Tax Revenue Deadweight Loss If the Government Taxes...
Step by Step Solution
There are 3 Steps involved in it

Get step-by-step solutions from verified subject matter experts