

Question: need help asap pleaseee The graph illustrates a normal distribution for the prices paid for a particular model of HD television. The mean price paid
need help asap pleaseee 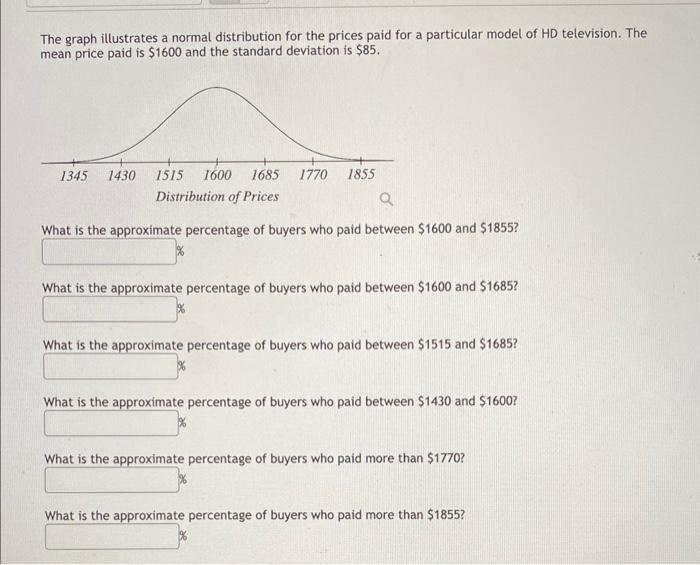
The graph illustrates a normal distribution for the prices paid for a particular model of HD television. The mean price paid is $1600 and the standard deviation is $85. What is the approximate percentage of buyers who paid between $1600 and $1855? What is the approximate percentage of buyers who paid between $1600 and $1685? What is the approximate percentage of buyers who paid between $1515 and $1685? What is the approximate percentage of buyers who paid between $1430 and $1600? What is the approximate percentage of buyers who paid more than $1770 ? What is the approximate percentage of buyers who paid more than $1855
Step by Step Solution
There are 3 Steps involved in it
1 Expert Approved Answer
Step: 1 Unlock

Question Has Been Solved by an Expert!
Get step-by-step solutions from verified subject matter experts
Step: 2 Unlock
Step: 3 Unlock