

Question: Need help figuring out the formula for MA2 and Y/MA2 in Excel. The data below represent the call volumes over 16 quarters from a call
Need help figuring out the formula for MA2 and Y/MA2 in Excel.
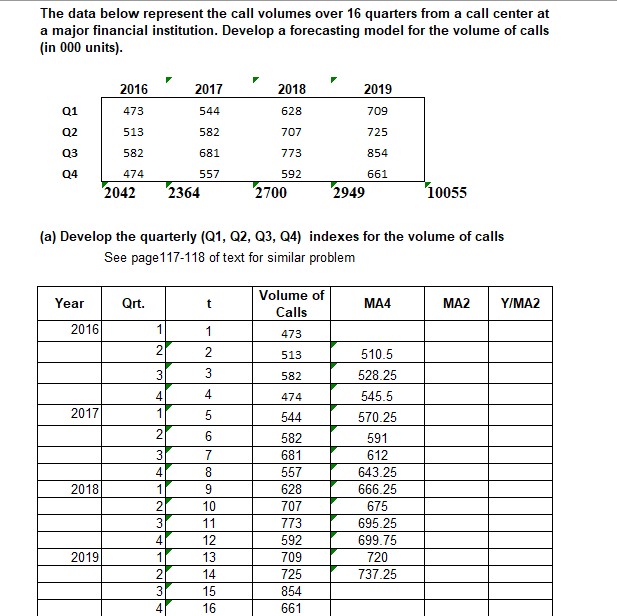
The data below represent the call volumes over 16 quarters from a call center at a major financial institution. Develop a forecasting model for the volume of calls (in 000 units). 2016 2017 2018 2019 Q1 473 544 628 709 Q2 513 582 725 707 773 Q3 582 681 854 Q4 557 474 2042 2364 592 2700 661 2949 10055 (a) Develop the quarterly (Q1, Q2, Q3, Q4) indexes for the volume of calls See page 117-118 of text for similar problem Year Qrt. t Volume of Calls MA4 MA2 Y/MA2 2016 1 1 473 2 | | 513 582 4 4 474 2017 1 544 582 681 |N| | 510.5 528.25 545.5 570.25 591 612 643.25 666.25 675 695.25 699.75 720 737.25 557 5 6 7 8 9 10 11 12 13 14 15 16 2018 628 707 773 592 709 725 854 661 2019Step by Step Solution
There are 3 Steps involved in it
1 Expert Approved Answer
Step: 1 Unlock

Question Has Been Solved by an Expert!
Get step-by-step solutions from verified subject matter experts
Step: 2 Unlock
Step: 3 Unlock