

Question: The data below represent the call volumes over 16 quarters from a call center at a major financial institution. Develop a forecasting model for the
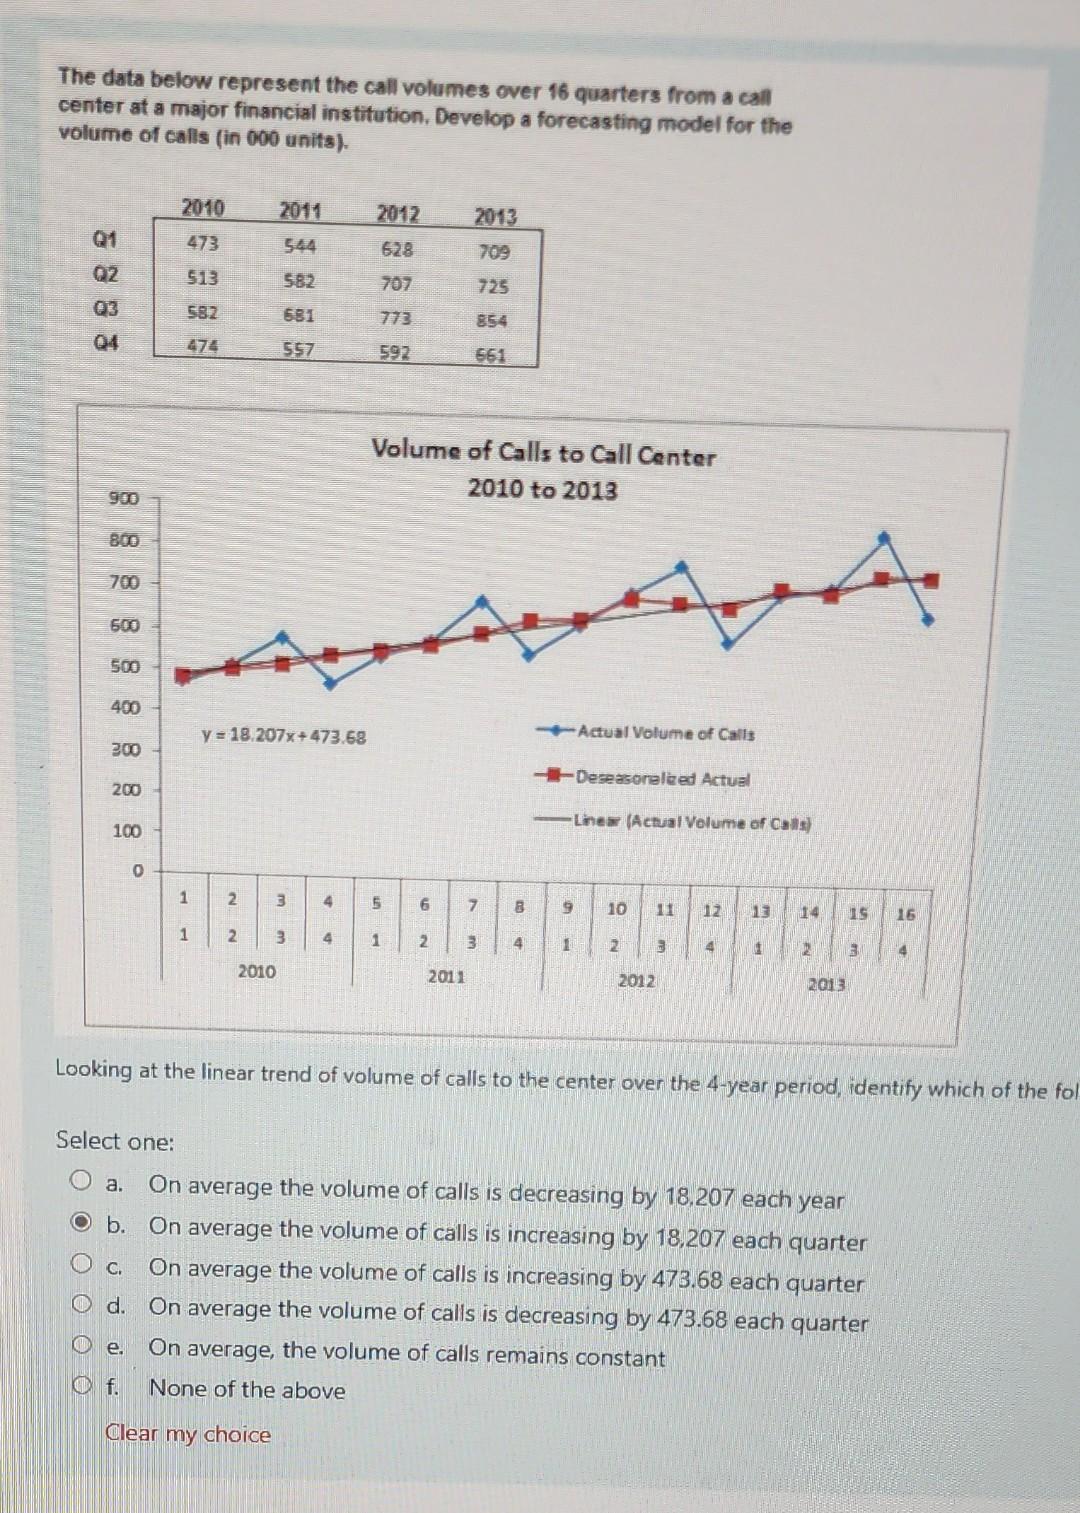
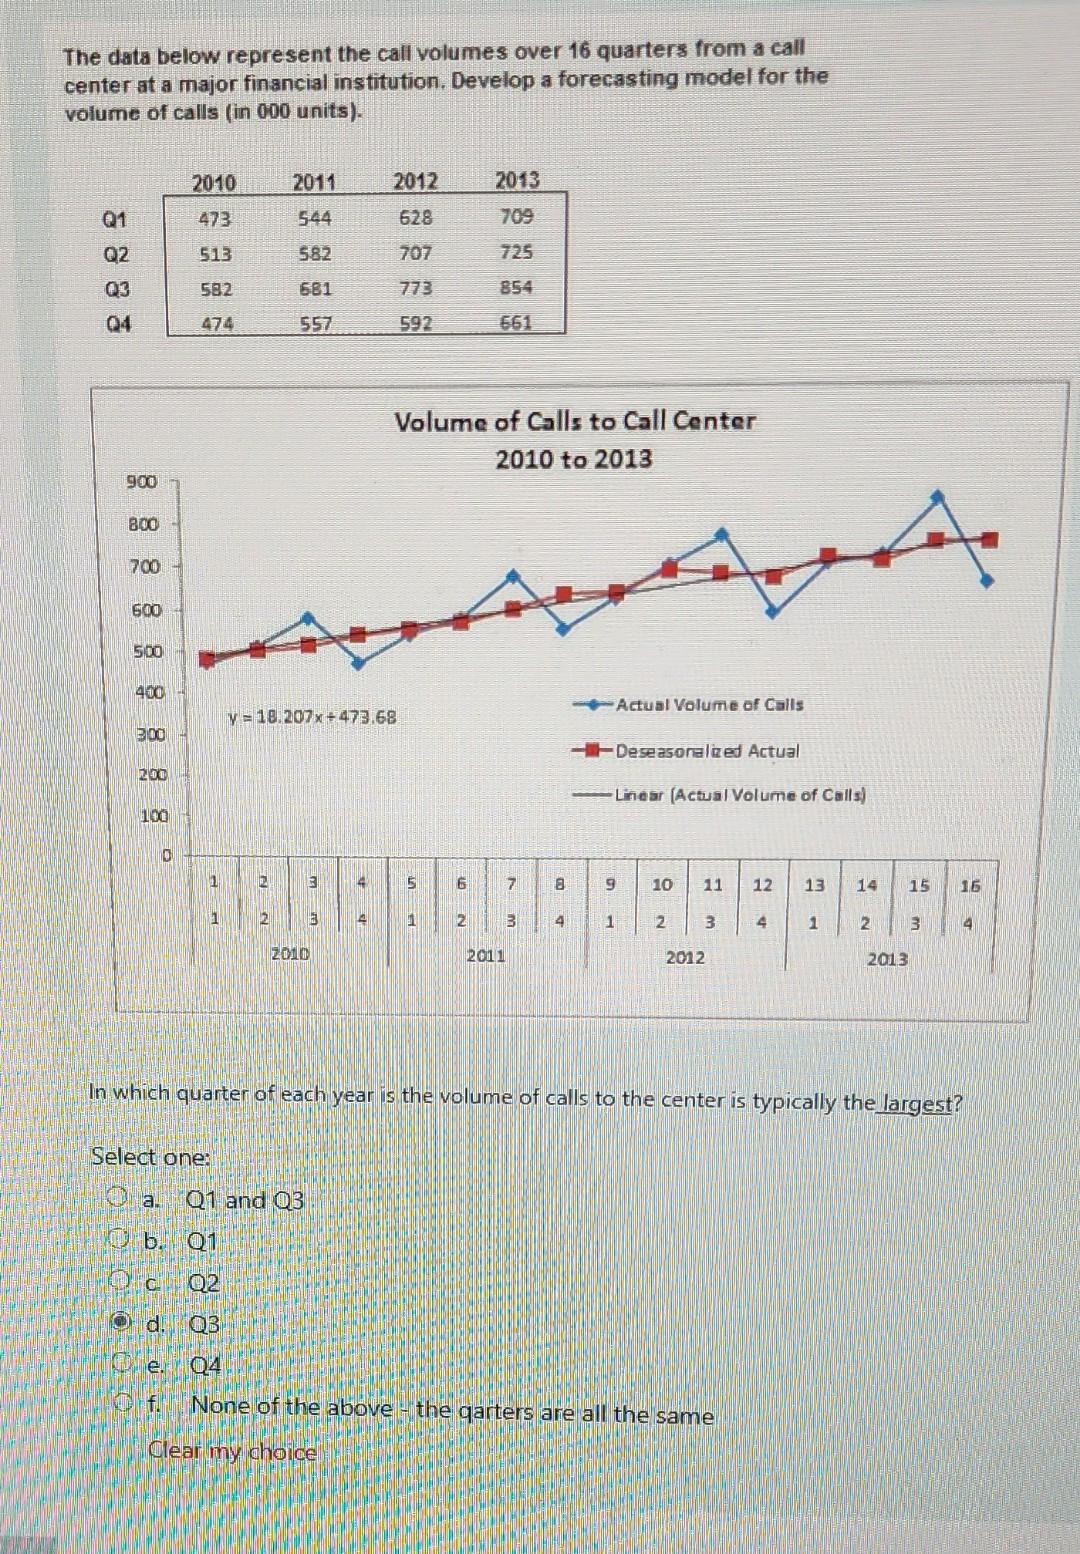
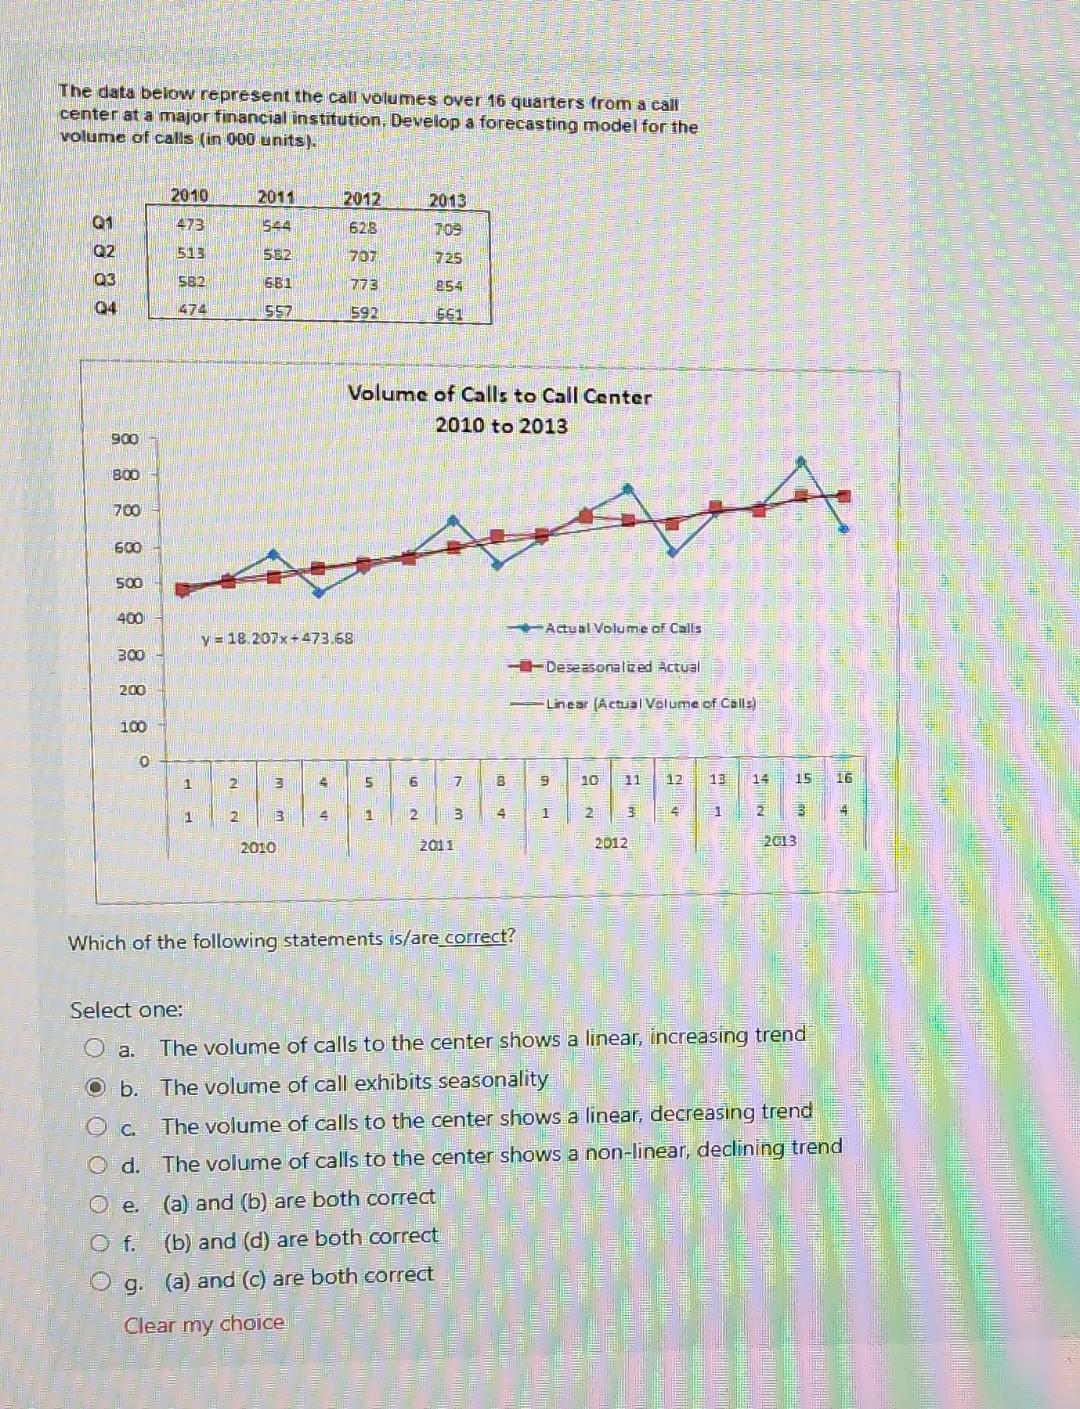
The data below represent the call volumes over 16 quarters from a call center at a major financial institution. Develop a forecasting model for the volume of calls (in 000 units). Looking at the linear trend of volume of calls to the center over the 4-year period, identify which of the fo Select one: a. On average the volume of calls is decreasing by 18,207 each year b. On average the volume of calls is increasing by 18,207 each quarter c. On average the volume of calls is increasing by 473.68 each quarter d. On average the volume of calls is decreasing by 473.68 each quarter e. On average, the volume of calls remains constant f. None of the above Clear my choice The data below represent the call volumes over 16 quarters from a call center at a major financial institution. Develop a forecasting model for the volume of calls (in 000 units). In which quarter of each year is the volume of calls to the center is typically the largest? Select one: a. Q1 and Q3. b. Q1 c Q2 d. Q3 e. Q4 f. None of the above - the qarters are all the same Clear my choice The data below represent the call volumes over 16 quarters from a call center at a major financial institution. Develop a forecasting model for the volume of calls (in 000 units). Which of the following statements is/are correct? Select one: a. The volume of calls to the center shows a linear, increasing trend b. The volume of call exhibits seasonality c. The volume of calls to the center shows a linear, decreasing trend d. The volume of calls to the center shows a non-linear, declining trend e. (a) and (b) are both correct f. (b) and (d) are both correct 9. (a) and (c) are both correct Clear my choice
Step by Step Solution
There are 3 Steps involved in it

Get step-by-step solutions from verified subject matter experts