

Question: The data below represent the call volumes over 16 quarters from a call center at a major financial institution. Develop a forecasting model for the
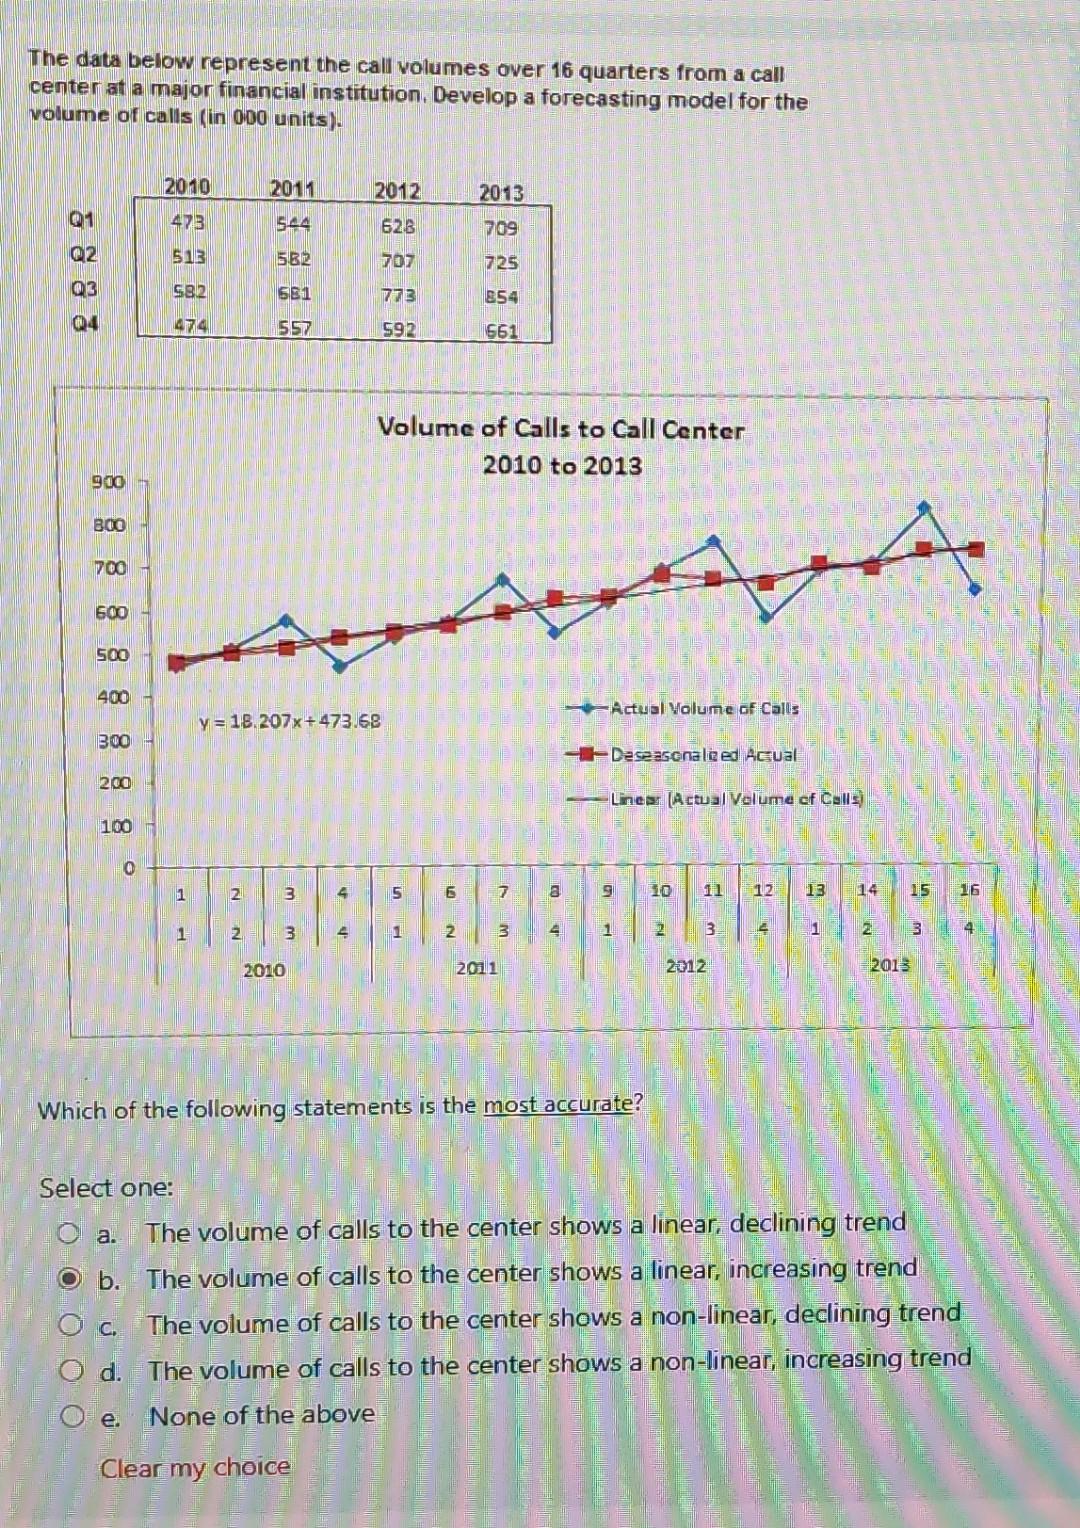
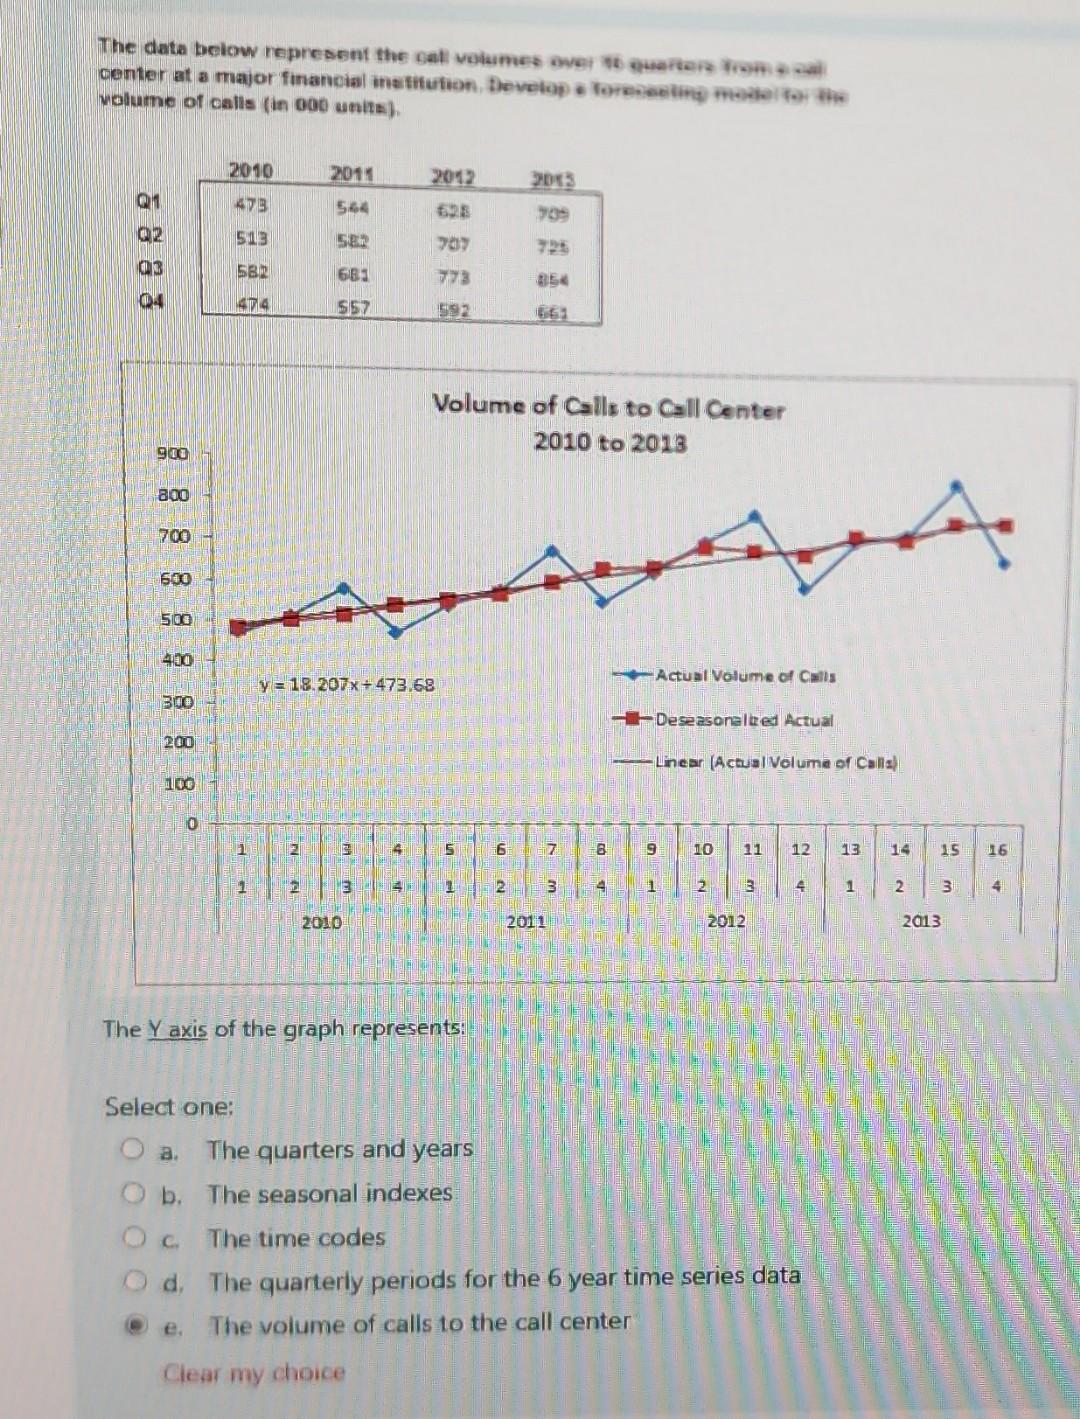
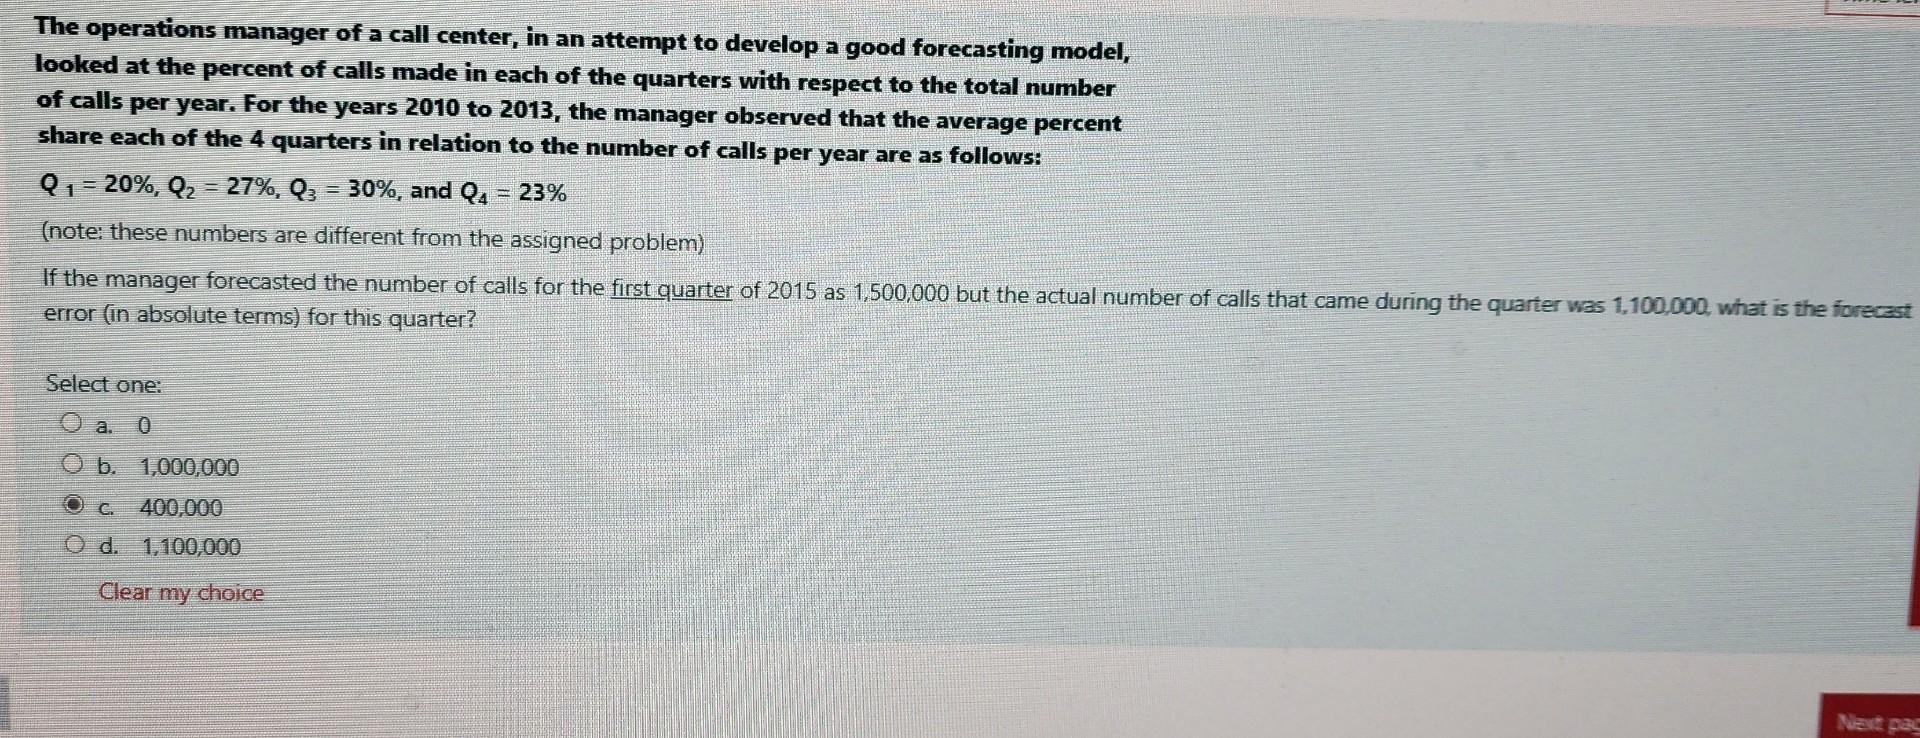
The data below represent the call volumes over 16 quarters from a call center at a major financial institution. Develop a forecasting model for the volume of calls (in 000 units). Which of the following statements is the most accurate? Select one: a. The volume of calls to the center shows a linear, declining trend b. The volume of calls to the center shows a linear, increasing trend c. The volume of calls to the center shows a non-linear, declining trend d. The volume of calls to the center shows a non-linear, increasing trend e. None of the above Clear my choice conter at a major financial ine velume of calis (in 000 unita). The Y axis of the graph represents: Select one: a. The quarters and years b. The seasonal indexes c. The time codes d. The quarterly periods for the 6 year time series data e. The volume of calls to the call center Clear my choice looked at the percent of calls made in each of the quarters with respect to the total number of calls per year. For the years 2010 to 2013, the manager observed that the average percent share each of the 4 quarters in relation to the number of calls per year are as follows: Q1=20%,Q2=27%,Q3=30%,andQ4=23% (note: these numbers are different from the assigned problem) If the manager forecasted the number of calls for the first quarter of 2015 as 1,500,000 but the actual number of calls that came during the quarter was 1,100,000, what is the forecast error (in absolute terms) for this quarter? Select one: a. 0 b. 1,000,000 c. 400,000 d. 1,100,000 Clear my choice
Step by Step Solution
There are 3 Steps involved in it

Get step-by-step solutions from verified subject matter experts