

Question: Need help generating this in Matlab. 1) generate_square_wave Write a function called generate_square_wave that generates a square wave. The desired amplitude, number of periods, and
Need help generating this in Matlab.
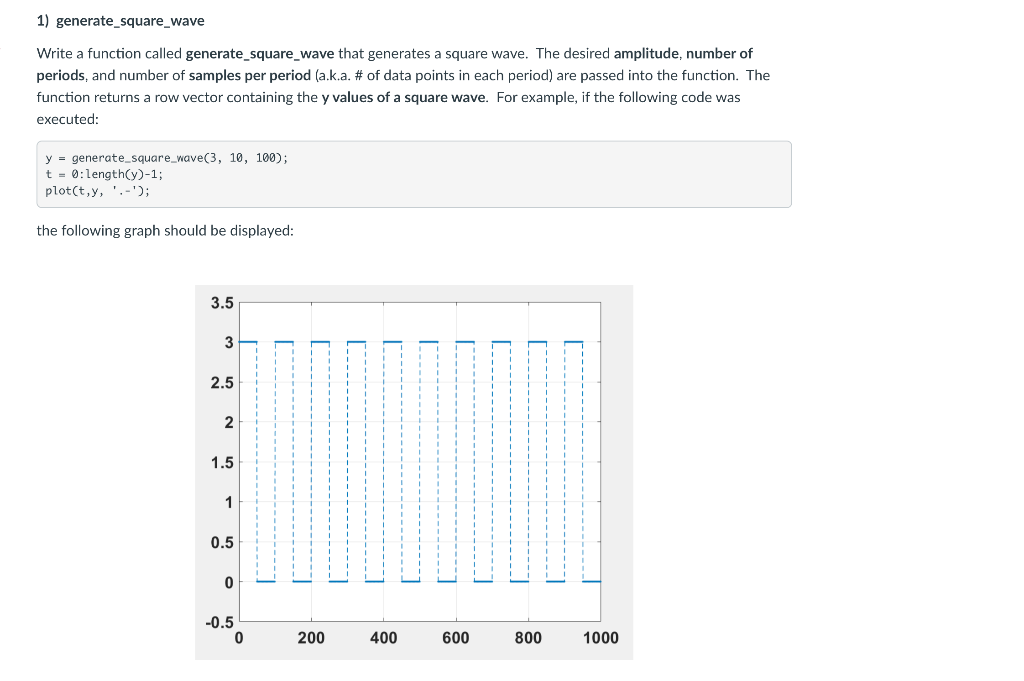
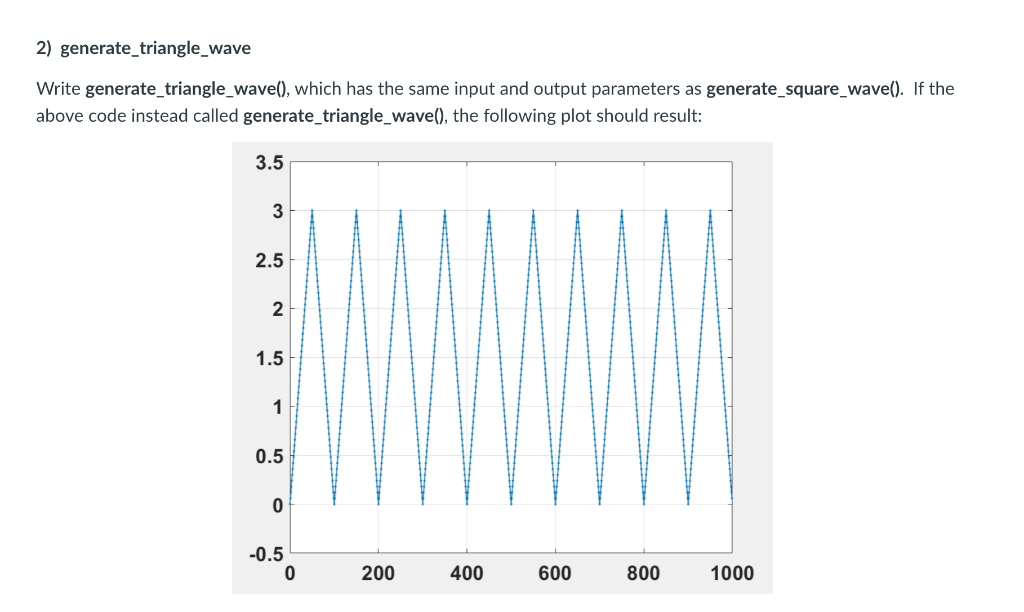
1) generate_square_wave Write a function called generate_square_wave that generates a square wave. The desired amplitude, number of periods, and number of samples per period (a.k.a. # of data points in each period) are passed into the function. The function returns a row vector containing the y values of a square wave. For example, if the following code was executed: y = generate_square_wave(3, 10, 100); t = 0: length(y)-1; plot(t,y, '.-'); the following graph should be displayed: 3.5 3 - - - - - - LI - 2.5 2 1.5 1 0.5 0 -0.5 0 200 400 600 800 1000 2) generate_triangle_wave Write generate_triangle_wave(), which has the same input and output parameters as generate_square_wave(). If the above code instead called generate_triangle_wave(), the following plot should result: 3.5 3 2.5 2 1.5 1 0.5 0 -0.5 0 200 400 600 800 1000
Step by Step Solution
There are 3 Steps involved in it

Get step-by-step solutions from verified subject matter experts