

Question: Need help in these problem Show that the n pieces of information in )(m -) are not independent; that is, show thatThe following data represent
Need help in these problem
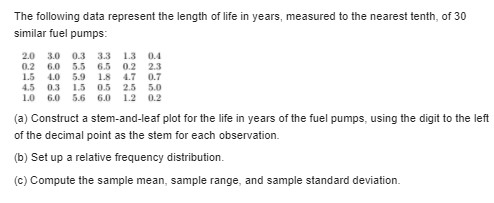
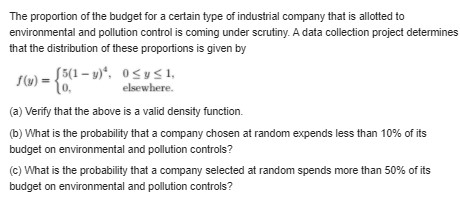
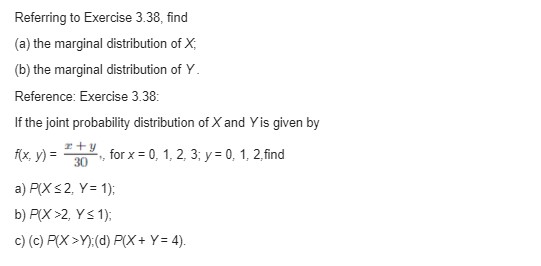
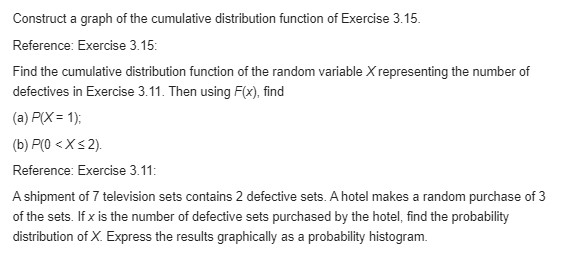
Show that the n pieces of information in )(m -) are not independent; that is, show thatThe following data represent the length of life in years, measured to the nearest tenth, of 30 similar fuel pumps: 2.0 3.0 03 3.3 1.3 0.4 0.2 6.0 5.5 6.5 02 23 1.5 4.0 5.9 18 4.7 0.7 4.5 0.3 1.5 0.5 2.5 5.0 1.0 6.0 5.6 6.0 1.2 0.2 (a) Construct a stem-and-leaf plot for the life in years of the fuel pumps, using the digit to the left of the decimal point as the stem for each observation. (b) Set up a relative frequency distribution. (c) Compute the sample mean, sample range, and sample standard deviation.\f\fThe proportion of the budget for a certain type of industrial company that is allotted to environmental and pollution control is coming under scrutiny. A data collection project determines that the distribution of these proportions is given by f (v) = 10. 5(1-y)'. OSys1. elsewhere. (a) Verify that the above is a valid density function. (b) What is the probability that a company chosen at random expends less than 10% of its budget on environmental and pollution controls? (c) What is the probability that a company selected at random spends more than 50% of its budget on environmental and pollution controls?Referring to Exercise 3.38, find (a) the marginal distribution of X; (b) the marginal distribution of Y Reference: Exercise 3.38: If the joint probability distribution of X and Yis given by f(x, y) = 30 for x = 0, 1, 2, 3; y = 0, 1, 2, find a) P(X 2, Y= 1); c) (c) P(X >Y):(d) P(X + Y = 4).Construct a graph of the cumulative distribution function of Exercise 3. 15. Reference: Exercise 3.15: Find the cumulative distribution function of the random variable X representing the number of defectives in Exercise 3.11. Then using F(x), find (a) P(X = 1); (b) P(0
Step by Step Solution
There are 3 Steps involved in it

Get step-by-step solutions from verified subject matter experts