

Question: Need help in these problem Show that the n pieces of information in )(m -) are not independent; that is, show thatffIf the joint probability
Need help in these problem
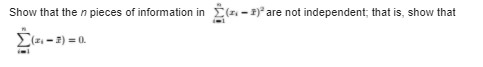
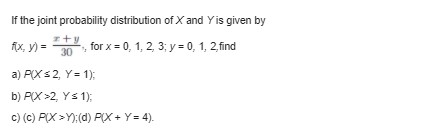
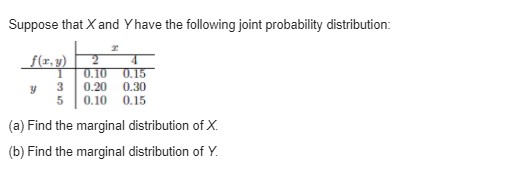
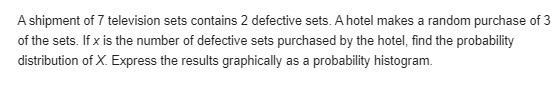
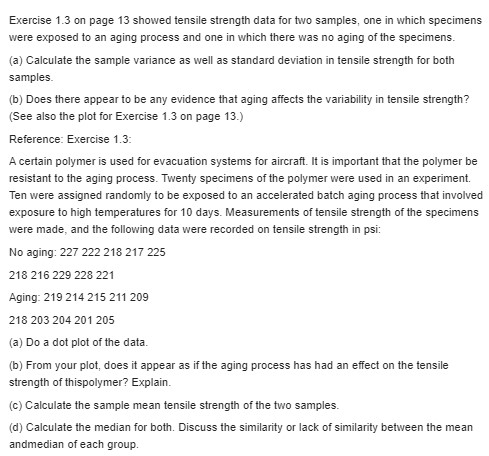
Show that the n pieces of information in )(m -) are not independent; that is, show that\f\fIf the joint probability distribution of X and Y is given by fx, V) = 30 , for x = 0, 1, 2, 3; y = 0, 1, 2, find a) P(X = 2, Y = 1). bj P(X( >2, Y= 1). c) (C) PIX >Y);(d) F( + Y = 4).Suppose that X and Y have the following joint probability distribution: f (x, y) 2 0.10 0.15 y 0.20 0.30 en 45 0.10 0.15 (a) Find the marginal distribution of X. (b) Find the marginal distribution of Y.A. shipment of 1" television sets contains 2 defective sets. A hotel makes a random purchase of 3 of the sets. If I is the number of defective sets purchased by the hotel, nd the probability distribution of X. Express the results graphically as a probability histogram. Exercise 1.3 on page 13 showed tensile strength data for two samples, one in which specimens were exposed to an aging process and one in which there was no aging of the specimens. (a) Calculate the sample variance as well as standard deviation in tensile strength for both samples. (b) Does there appear to be any evidence that aging affects the variability in tensile strength? (See also the plot for Exercise 1.3 on page 13.) Reference: Exercise 1.3: A certain polymer is used for evacuation systems for aircraft. It is important that the polymer be resistant to the aging process. Twenty specimens of the polymer were used in an experiment. Ten were assigned randomly to be exposed to an accelerated batch aging process that involved exposure to high temperatures for 10 days. Measurements of tensile strength of the specimens were made, and the following data were recorded on tensile strength in psi: No aging: 227 222 218 217 225 218 216 229 228 221 Aging: 219 214 215 211 209 218 203 204 201 205 (a) Do a dot plot of the data. (b) From your plot, does it appear as if the aging process has had an effect on the tensile strength of thispolymer? Explain. (c) Calculate the sample mean tensile strength of the two samples. (d) Calculate the median for both. Discuss the similarity or lack of similarity between the mean andmedian of each group
Step by Step Solution
There are 3 Steps involved in it

Get step-by-step solutions from verified subject matter experts