

Question: Need help Ks My library > MAT 240: Applied Statistics home > 3.1: Interpreting fitted models zyBooks catalog 2 Help/FAC The scatter plot shows the
Need help
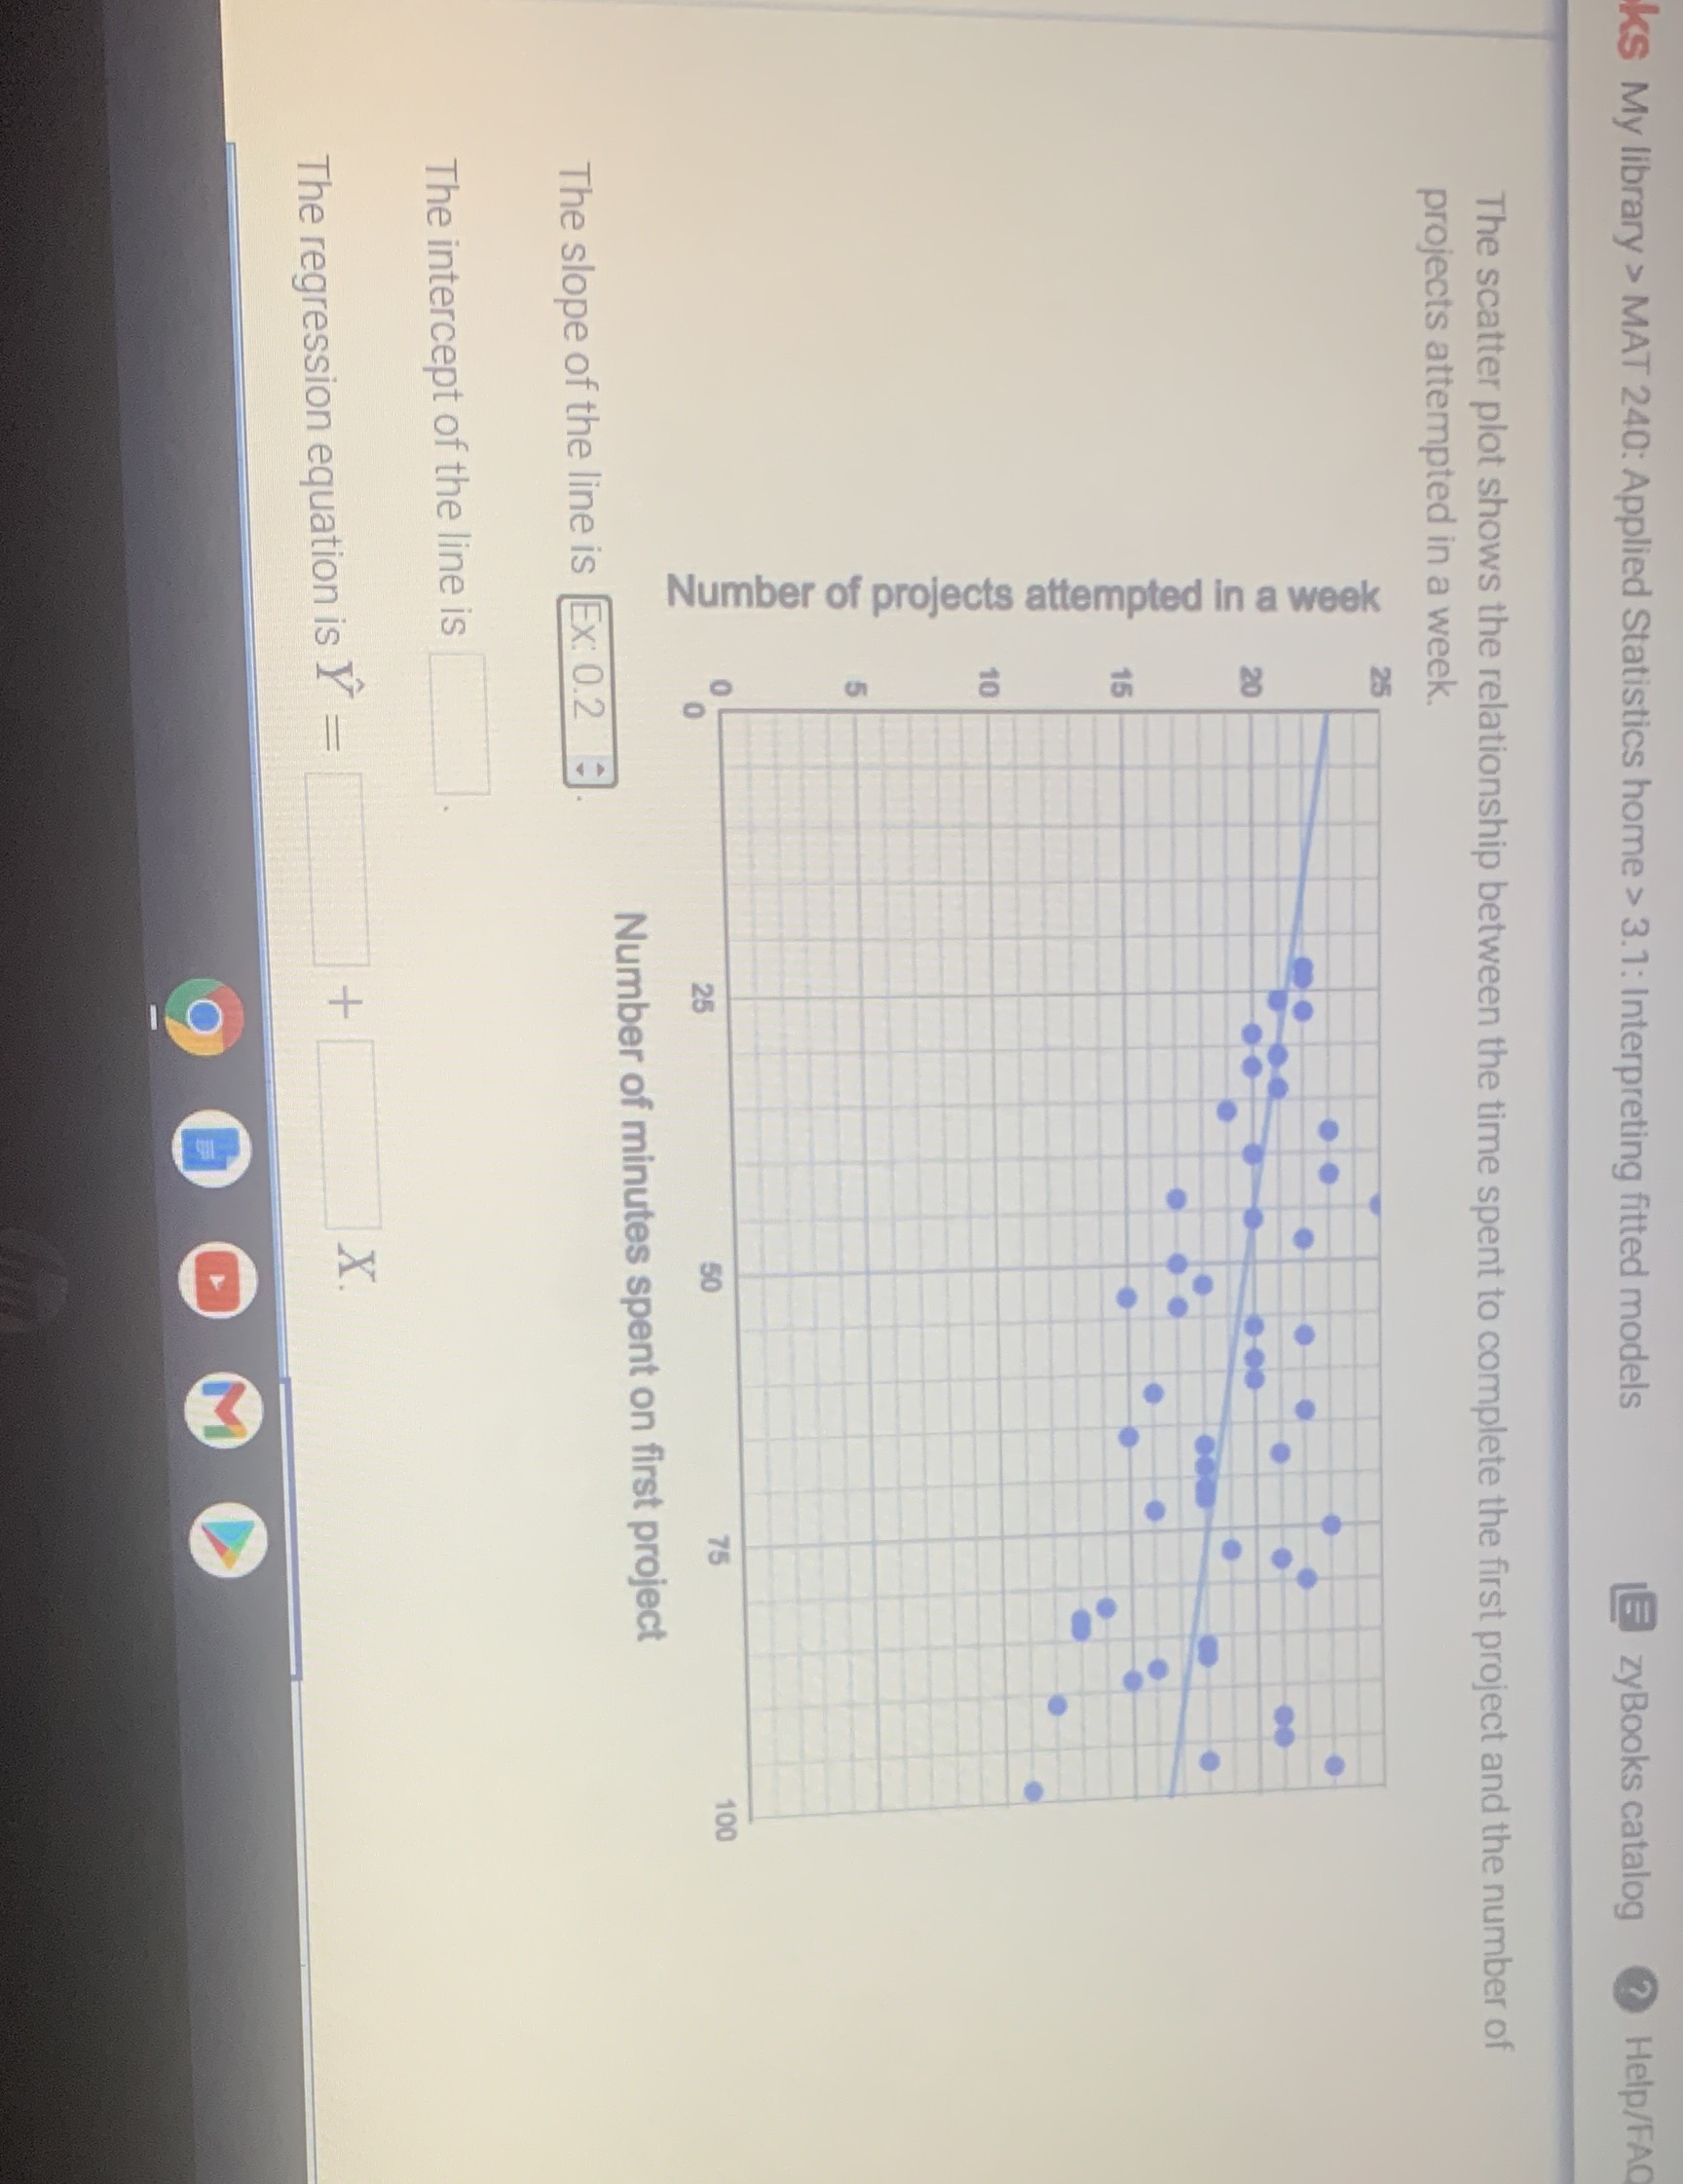
Ks My library > MAT 240: Applied Statistics home > 3.1: Interpreting fitted models zyBooks catalog 2 Help/FAC The scatter plot shows the relationship between the time spent to complete the first project and the number of projects attempted in a week. Number of projects attempted in a week 8 100 Number of minutes spent on first project The slope of the line is Ex: 0.2 : The intercept of the line is The regression equation is Y = + D A
Step by Step Solution
There are 3 Steps involved in it
1 Expert Approved Answer
Step: 1 Unlock

Question Has Been Solved by an Expert!
Get step-by-step solutions from verified subject matter experts
Step: 2 Unlock
Step: 3 Unlock