

Question: NEED HELP ON MATLAB CODE In Matlab, create the plot shown below using two different methods. It is the surface of a sphere with radius
NEED HELP ON MATLAB CODE
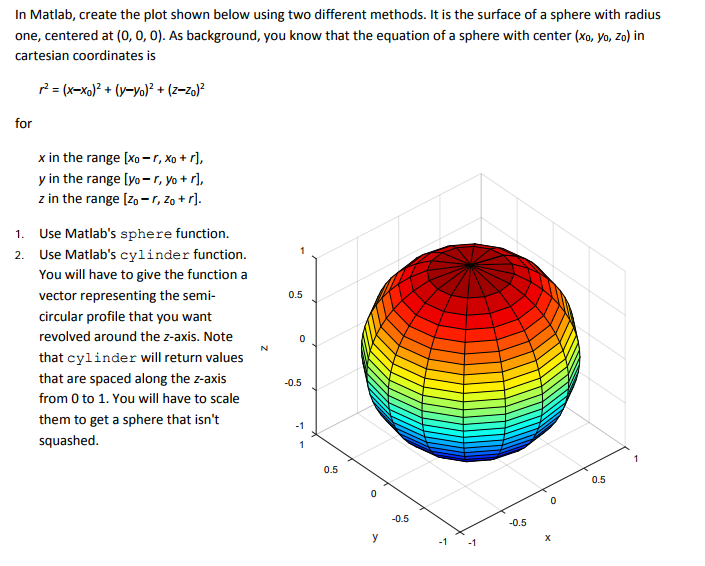
In Matlab, create the plot shown below using two different methods. It is the surface of a sphere with radius one, centered at (0, 0, 0). As background, you know that the equation of a sphere with center (xo, yo, Zo) in cartesian coordinates is r' = (x-xo)2 + (y-yo)2 + (Z-20)2 for x in the range [xo-r, xorl, y in the range [yo- r, yo r, z in the range [zo- r, Zo+r] Use Matlab's sphere function Use Matlab's cylinder function. You will have to give the function a vector representing the semi- circular profile that you want revolved around the z-axis. Note that cylinder will return values that are spaced along the z-axis from 0 to 1. You will have to scale them to get a sphere that isn't squashed 1. 2. 0.5 -0.5 0.5 0.5 0.5 0.5
Step by Step Solution
There are 3 Steps involved in it

Get step-by-step solutions from verified subject matter experts