

Question: Need help on this, can someone chart out what it is supposed to look like on the graph and provide explanation why? Task time estimates
Need help on this, can someone chart out what it is supposed to look like on the graph and provide explanation why?
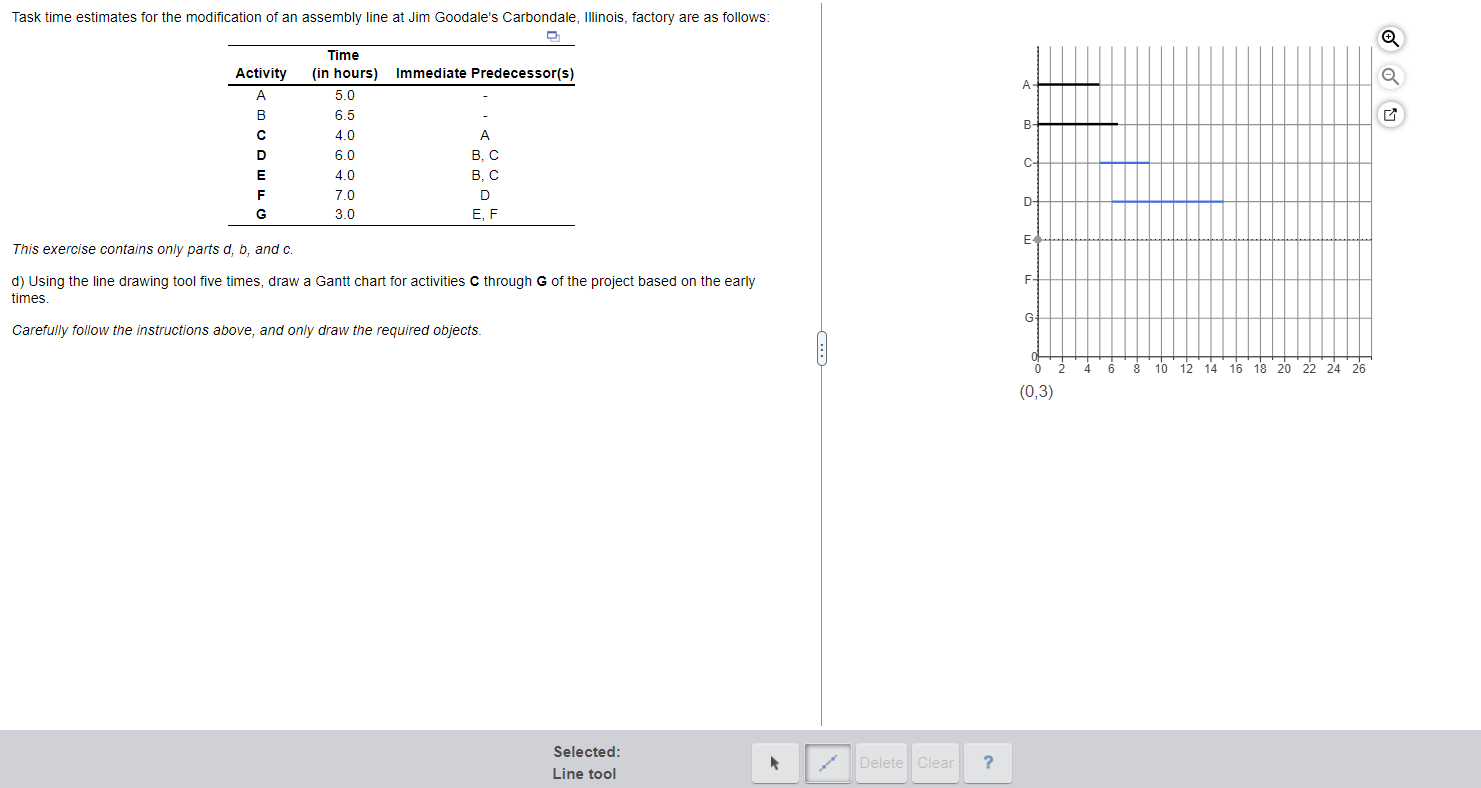
Task time estimates for the modification of an assembly line at Jim Goodale's Carbondale, Illinois, factory are as follows: This exercise contains only parts d,b, and c. d) Using the line drawing tool five times, draw a Gantt chart for activities C through G of the project based on the early times. Carefully follow the instructions above, and only draw the required objects
Step by Step Solution
There are 3 Steps involved in it
To create a Gantt chart for activities C through G based on the early start times follow these steps ... View full answer

Get step-by-step solutions from verified subject matter experts