

Question: need help on this please 22. Temperature. The given graph shows the outside temperature T in c'F, between 6am and 7pm. 80 T0 60 50
need help on this please
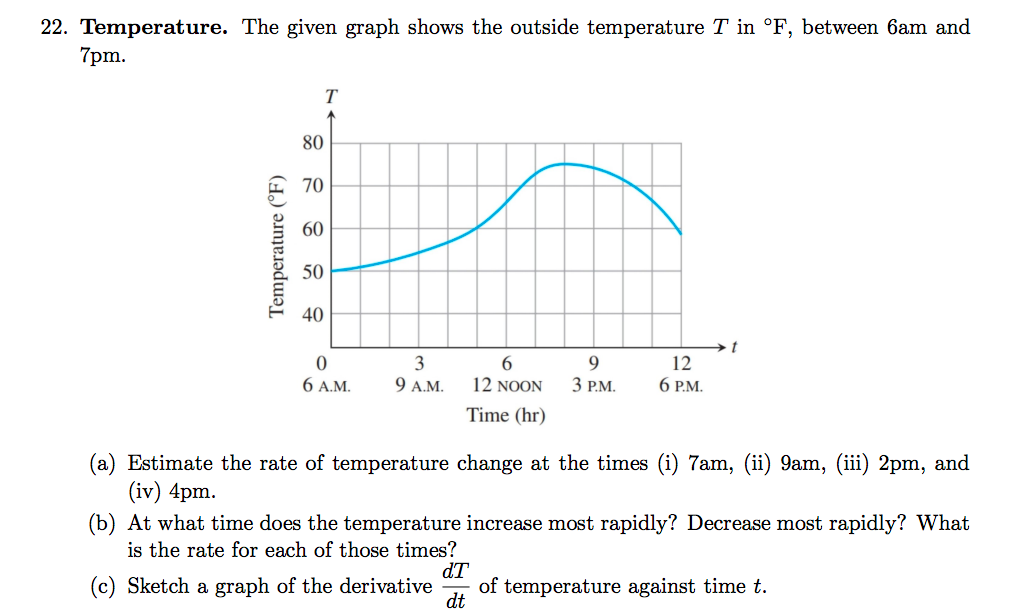
22. Temperature. The given graph shows the outside temperature T in c'F, between 6am and 7pm. 80 T0 60 50 Temperature (\"Fl 40 0 12 6AM. 9AM.12NOON 3PM. 6PM. Time (hr) (a) Estimate the rate of temperature change at the times (i) 7am, (ii) 9am, (iii) 2pm, and (iv) 4pm. (b) At what time does the temperature increase most rapidly? Decrease most rapidly? What is the rate for each of those times? (c) Sketch a graph of the derivative % of temperature against time t
Step by Step Solution
There are 3 Steps involved in it
1 Expert Approved Answer
Step: 1 Unlock

Question Has Been Solved by an Expert!
Get step-by-step solutions from verified subject matter experts
Step: 2 Unlock
Step: 3 Unlock