

Question: need help please. with explanation to help me understand what am missing. thanks QUESTION 1 Graph shows MR, MC, P, and AC curves 104 96
need help please. with explanation to help me understand what am missing. thanks
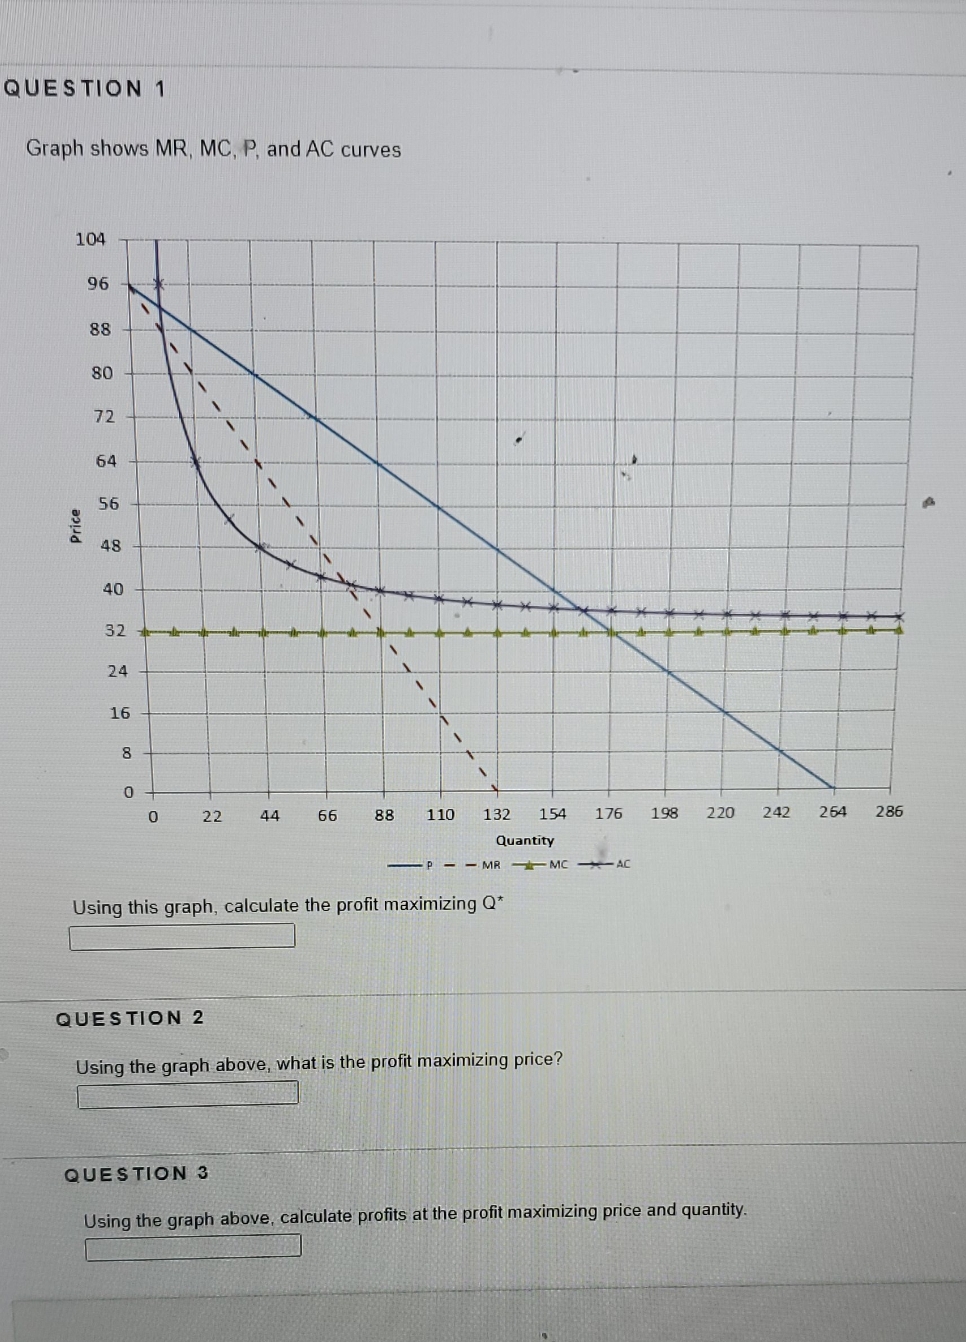
QUESTION 1 Graph shows MR, MC, P, and AC curves 104 96 88 80 72 64 56 Price 48 40 32 24 16 22 44 66 88 110 132 154 176 198 220 242 264 286 Quantity - MR MC - AC Using this graph, calculate the profit maximizing Q* QUESTION 2 Using the graph above, what is the profit maximizing price? QUESTION 3 Using the graph above, calculate profits at the profit maximizing price and quantity
Step by Step Solution
There are 3 Steps involved in it
1 Expert Approved Answer
Step: 1 Unlock

Question Has Been Solved by an Expert!
Get step-by-step solutions from verified subject matter experts
Step: 2 Unlock
Step: 3 Unlock