

Question: Need help solving ratios for General Electric based on 2016 10k Ratio Ratio Element Gross Margin Percentage Gross Margin Net Sales Profit Margin (ROS) Net
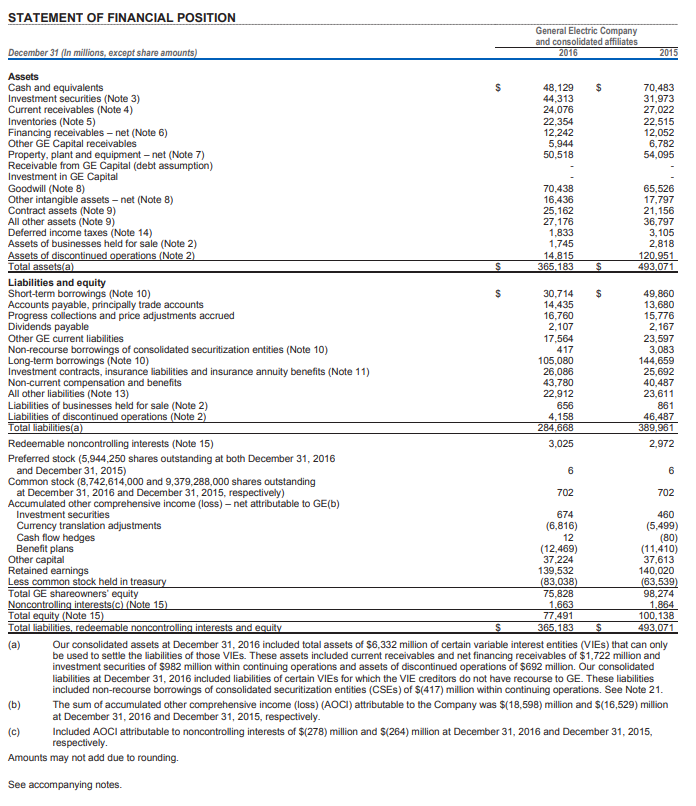
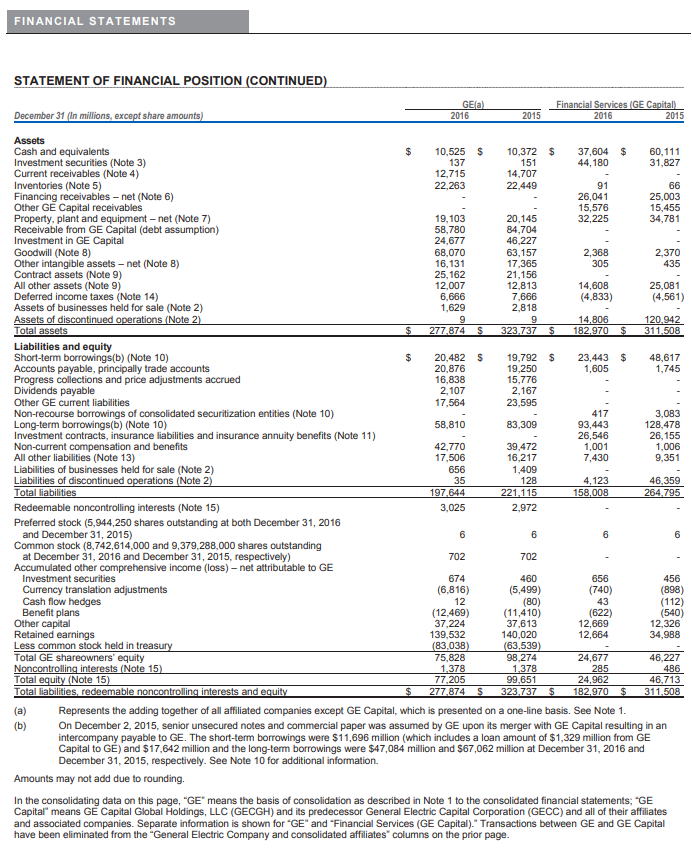
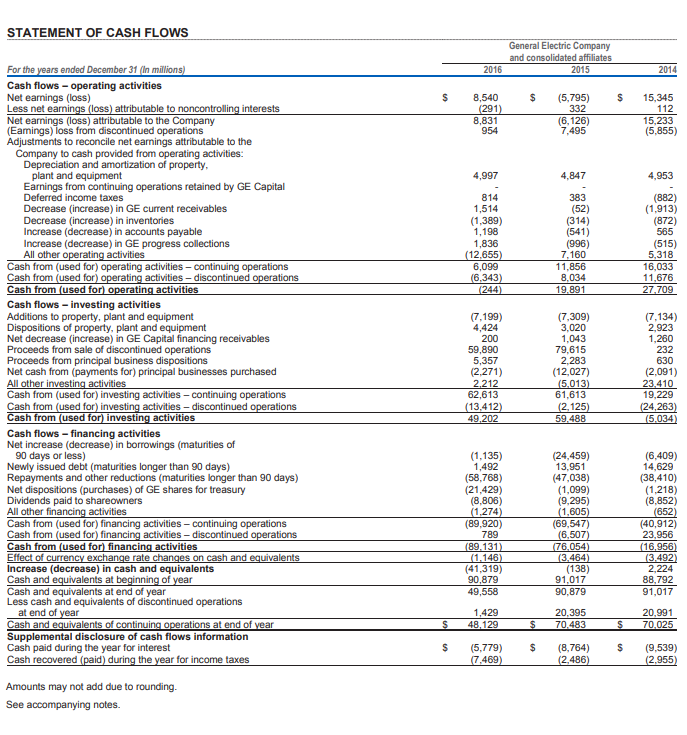
Need help solving ratios for General Electric based on 2016 10k
| Ratio | Ratio Element | |
| Gross Margin Percentage | Gross Margin | |
| Net Sales | ||
| Profit Margin (ROS) | Net Income | |
| Net Sales | ||
| EPS | NI - Preferred Dividends | |
| # CS outstanding | ||
| P/E ratio | Market Price of stock | |
| EPS | ||
| Return on Total Assets | NI + (Interest x (1-tax rate)) | |
| Average Total Assets | ||
| Return on common SE | NI - Preferred Dividends | |
| Average SE - Average Preferred Stock | ||
| Book value per common share | SE - Preferred Stock | |
| # CS | ||
| Current ratio | CA | |
| CL | ||
| Acid test ratio | Cash + Marketable Sec + Net AR | |
| CL | ||
| AR turnover | Sales on account | |
| Ave AR | ||
| Average collection period | 365 | |
| AR Turnover | ||
| Inventory turnover | CGS | |
| Ave Inventory | ||
| Average sale period | 365 | |
| Inventory Turnover | ||
| AP Turnover Ratio | CGS + EI | |
| Average AP | ||
| Average AP payment in days | 365 | |
| AP Turnover Ratio | ||
| Times interest earned | EBIT | |
| Interest Expense | ||
| Debt-to-equity ratio | Total Liabilities | |
| Stockholder's Equity | ||
| Debt ratio | Total Liabilities | |
| Total Assets |
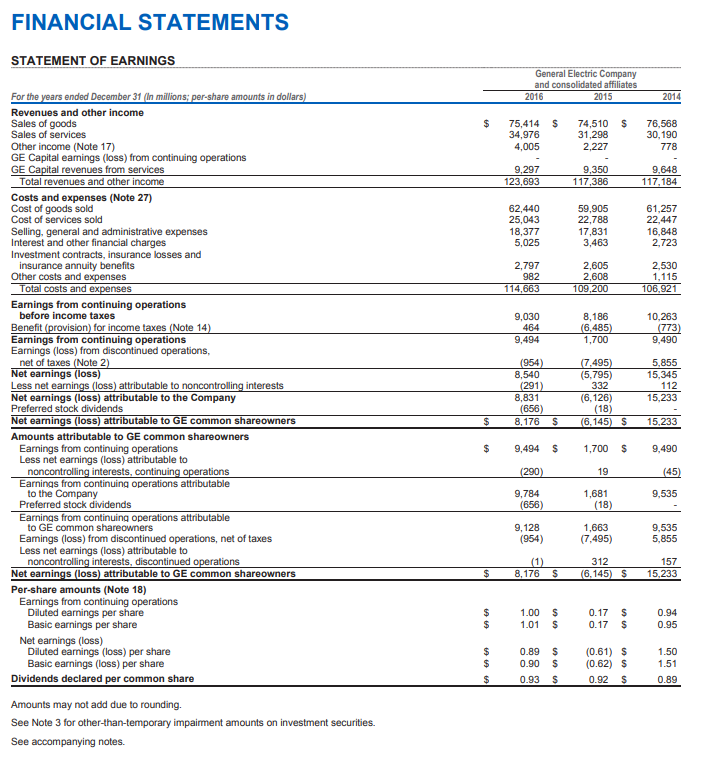
FINANCIAL STATEMENTS STATEMENT OF EARNINGS General Electric C and consolidated affiliates ended December 31 (In millions, amounts in dollars 2015 Revenues and other income Sales of goods Sales of services Other income (Note 17) GE Capital earnings (loss) from continuing operations GE $ 75,414 S 74,510 S76,568 30,190 34,976 31,298 2,227 pital revenues from services 9,297 Total revenues and other income Costs and expenses (Note 27) Cost of goods sold Cost of services sold Selling, general and administrative expenses Interest and other financial charges Investment contracts, insurance losses and 62,440 25,043 18,377 5,025 59,905 22,788 17,831 3,463 61,257 22,447 16,848 2,723 2,797 982 2,605 2,608 2,530 insurance annuity benefits Other costs and expenses otal costs and e expenses Earnings from continuing operations before income taxes Benefit Earnings from continuing operations Earnings (loss) from discontinued operations, 9,030 464 9,494 10,263 485 1,700 vision) for income taxes 9,490 net of taxes earnings (loss) 8,540 15,345 (5,795) (6,126) 6,145) S 15,233 loss) attributable to noncontrolling interests Less net Net earnings (loss) attributable to the Company Preferred stock dividends Net earnings (loss) attributable to GE common shareowners Amounts attributable to GE common shareowners 8,831 18) Earnings from continuing operations Less net earnings (loss) attributable to $ 9,494 S70 9,490 1,681 9,535 to the Company Preferred stock drvidends Earnings from continuing operations attributable to GE common shareowners Eamings (loss) from discontinued operations, net of taxes Less net earnings (loss) attributable to 1,663 (7,495) 9,535 5,855 (954) noncontrolling interests, discontinued ons Net earnings (loss) attributable to GE common shareowners $ 8,176 S (6,145) S 15,233 Per-share amounts (Note 18) Earnings from continuing operations Diluted earnings per share Basic earnings per share Net earnings (loss) Diluted earnings (loss) per share Basic earnings (loss) per share (0.62) S Dividends declared per common share Amounts may not add due to rounding. See Note 3 for other-than-temporary impairment amounts on investment securities. See accompanying notes
Step by Step Solution
There are 3 Steps involved in it

Get step-by-step solutions from verified subject matter experts