

Question: Need help specifially answering for both Wal-Mart & Macys for all the calculations mentioned above. *also need more detailed calculations for APT, INVT, PPET 68
 Need help specifially answering for both Wal-Mart & Macys for all the calculations mentioned above.
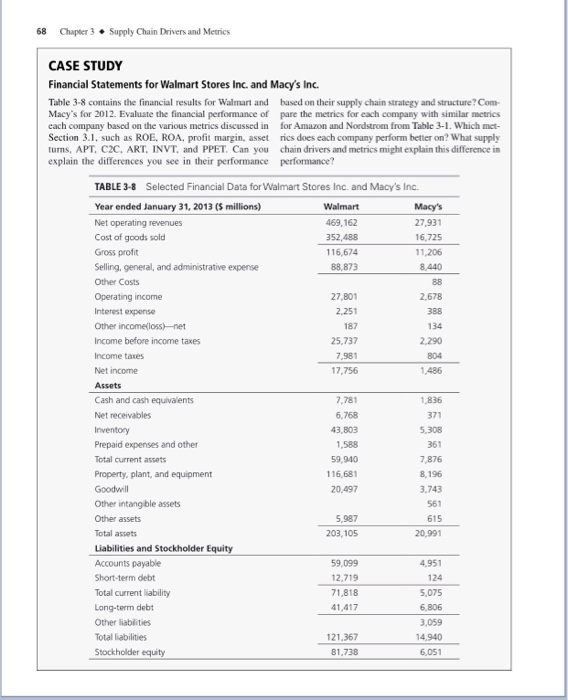
 68 Chapter 3 . Supply Chain Drivers and Metrics CASE STUDY Financial Statements for Walmart Stores Inc. and Macy's Inc. Table 3-8 contains the financial results for Walmart and based on their supply chain strategy and structure? Com Macy's for 2012. Evaluate the financial performance of pare the metrics for each company with similar metrics cach company based on the various metrics discussed in for Amazon and Nordstrom from Table 3-1. Which met Section 3.1, such as ROE, ROA, profit margin, assetrics does each company perform better on? What supply turns, APT, C2C, ART, INVT, and PPET. Can you chain drivers and metrics might explain this difference in explain the differences you see in their performance performance? 388 187 TABLE 3-8 Selected Financial Data for Walmart Stores Inc. and Macy's Inc. Year ended January 31, 2013 (5 millions) Walmart Macy's Net operating revenues 469,162 27,931 Cost of goods sold 352,488 16,725 Gross profit 116,674 11,206 Selling, general, and administrative expense 88 873 8.440 Other Costs Operating income 27,801 2,678 Interest expense 2.251 Other income loss)-net Income before income taxes 25.737 2,290 Income taxes 7,981 804 Net income 17,756 1,486 Assets Cash and cash equivalents 7,781 1836 Net receivables 6.768 Inventory 43,803 5,308 Prepaid expenses and other 1.588 361 Total current assets 59,940 7.876 Property, plant, and equipment 116,681 8.196 Goodwill 20.497 3.743 Other intangible assets 561 Other assets 5,987 615 Total assets 203,105 20.991 Liabilities and Stockholder Equity Accounts payable 59.099 4951 Short-term debt 12,719 124 Total current ability 71,818 5.075 Long-term debt 41.417 6905 Other abilities 3.059 Total liabilities 121.367 14 940 Stockholder equity 81.738 6,051 68 Chapter 3 . Supply Chain Drivers and Metrics CASE STUDY Financial Statements for Walmart Stores Inc. and Macy's Inc. Table 3-8 contains the financial results for Walmart and based on their supply chain strategy and structure? Com Macy's for 2012. Evaluate the financial performance of pare the metrics for each company with similar metrics cach company based on the various metrics discussed in for Amazon and Nordstrom from Table 3-1. Which met Section 3.1, such as ROE, ROA, profit margin, assetrics does each company perform better on? What supply turns, APT, C2C, ART, INVT, and PPET. Can you chain drivers and metrics might explain this difference in explain the differences you see in their performance performance? 388 187 TABLE 3-8 Selected Financial Data for Walmart Stores Inc. and Macy's Inc. Year ended January 31, 2013 (5 millions) Walmart Macy's Net operating revenues 469,162 27,931 Cost of goods sold 352,488 16,725 Gross profit 116,674 11,206 Selling, general, and administrative expense 88 873 8.440 Other Costs Operating income 27,801 2,678 Interest expense 2.251 Other income loss)-net Income before income taxes 25.737 2,290 Income taxes 7,981 804 Net income 17,756 1,486 Assets Cash and cash equivalents 7,781 1836 Net receivables 6.768 Inventory 43,803 5,308 Prepaid expenses and other 1.588 361 Total current assets 59,940 7.876 Property, plant, and equipment 116,681 8.196 Goodwill 20.497 3.743 Other intangible assets 561 Other assets 5,987 615 Total assets 203,105 20.991 Liabilities and Stockholder Equity Accounts payable 59.099 4951 Short-term debt 12,719 124 Total current ability 71,818 5.075 Long-term debt 41.417 6905 Other abilities 3.059 Total liabilities 121.367 14 940 Stockholder equity 81.738 6,051
Step by Step Solution
There are 3 Steps involved in it

Get step-by-step solutions from verified subject matter experts