

Question: NEED HELP, thank you. Sample data for the gross income for the last months was collected. Due to the non-linear nature of the gross income,
NEED HELP, thank you.
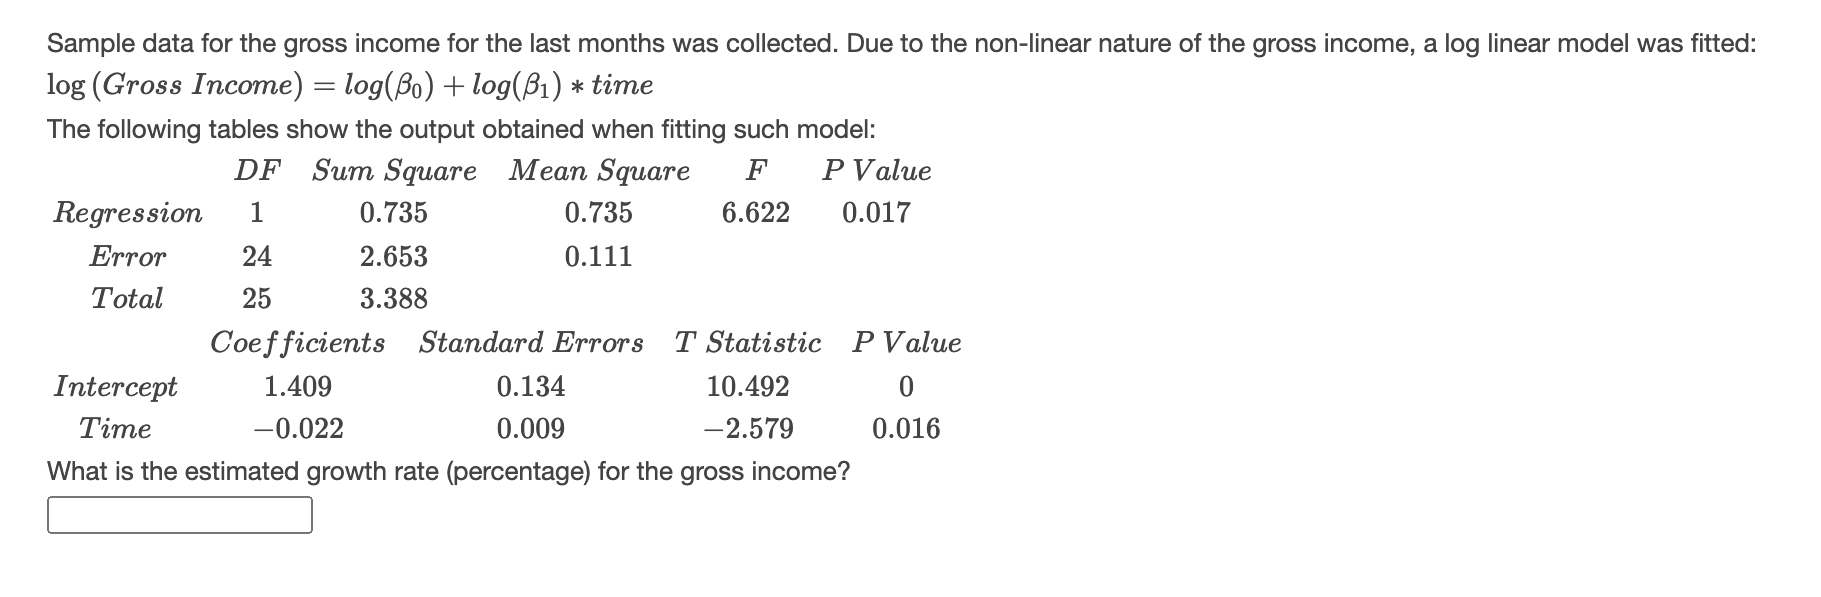
Sample data for the gross income for the last months was collected. Due to the non-linear nature of the gross income, a log linear model was fitted: 10g (Gross Income) 2 109060) +log(,81) * time The following tables show the output obtained when fitting such model: DF Sum Square Mean Square F P Value Regression 1 0.735 0.735 6.622 0.017 Error 24 2.653 0.111 Total 25 3.388 Coefficients Standard Errors T Statistic P Value Intercept 1.409 0.134 10.492 0 Time 0.022 0.009 2.579 0.016 What is the estimated growth rate (percentage) for the gross income? :1
Step by Step Solution
There are 3 Steps involved in it
1 Expert Approved Answer
Step: 1 Unlock

Question Has Been Solved by an Expert!
Get step-by-step solutions from verified subject matter experts
Step: 2 Unlock
Step: 3 Unlock