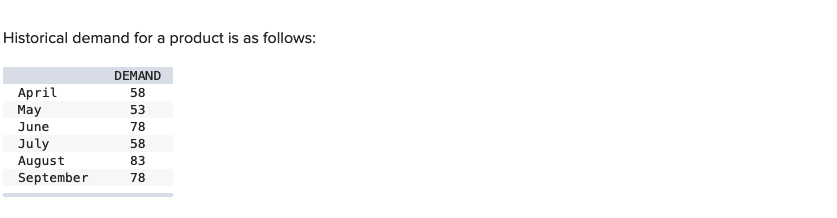
Question: Need help w D please c. Using simple linear regression, calculate the trend line for the historical data. Say the X axis is April =1,

Need help w D pleaseNeed help w D please c. Using simple linearNeed help w D please c. Using simple linear

c. Using simple linear regression, calculate the trend line for the historical data. Say the X axis is April =1, May =2, and so on, while the Y axis is demand. (Round your intercept value to the nearest whole number and slope value to 2 decimal places.) d. Calculate a forecast for October using your regression formula. (Round your answer to 2 decimal places.) Historical demand for a product is as follows

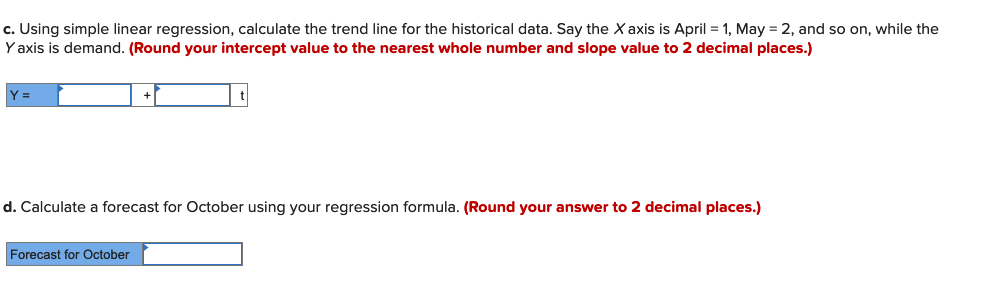
Step by Step Solution

There are 3 Steps involved in it

1 Expert Approved Answer
Step: 1 Unlock blur-text-image
Question Has Been Solved by an Expert!

Get step-by-step solutions from verified subject matter experts

Step: 2 Unlock
Step: 3 Unlock

Students Have Also Explored These Related General Management Questions!