

Question: need help. will thumbs up! Using Microsoft Excel, make a calibration curve for the data below. Include vertical error bars (indicating a 95% confidence interval)
need help. will thumbs up! 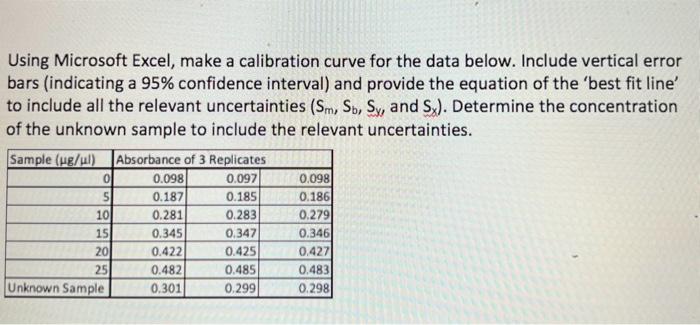
Using Microsoft Excel, make a calibration curve for the data below. Include vertical error bars (indicating a 95\% confidence interval) and provide the equation of the 'best fit line' to include all the relevant uncertainties (Sm,Sb,Sy and Sx). Determine the concentration of the unknown sample to include the relevant uncertainties
Step by Step Solution
There are 3 Steps involved in it
1 Expert Approved Answer
Step: 1 Unlock

Question Has Been Solved by an Expert!
Get step-by-step solutions from verified subject matter experts
Step: 2 Unlock
Step: 3 Unlock