

Question: Need help with #2. please show all steps. thanks TABLE 1.1: CONCENTRATION INFORMATION FOR THE DETERMINATION OF THE EFFECT OF IOMICEATO ATION ON THF RATE
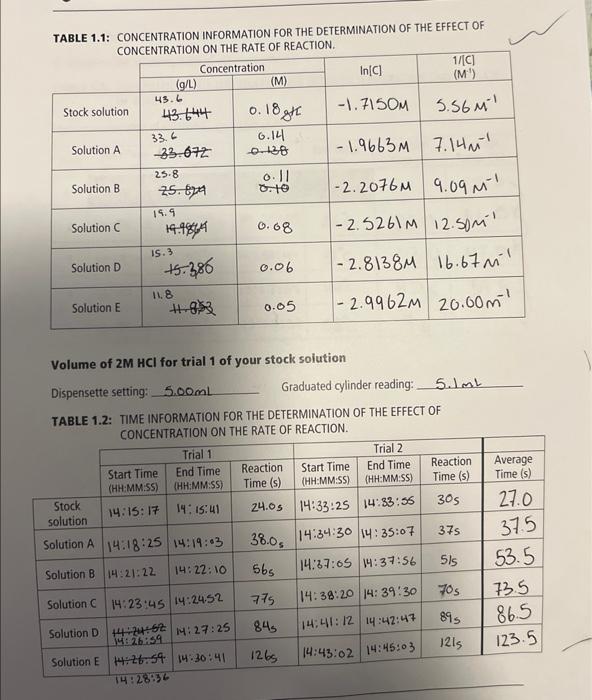
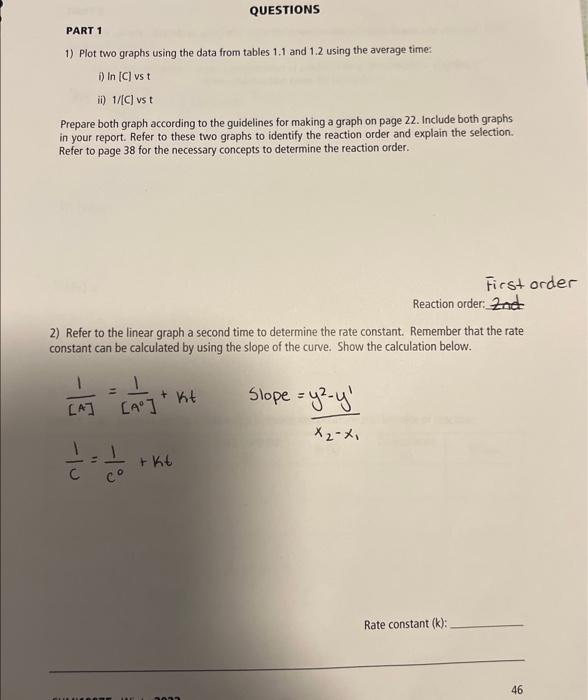
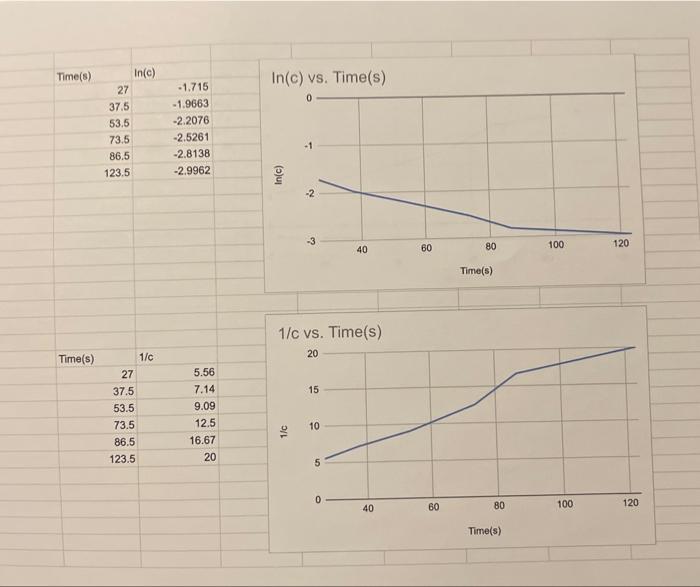
TABLE 1.1: CONCENTRATION INFORMATION FOR THE DETERMINATION OF THE EFFECT OF IOMICEATO ATION ON THF RATE OF REACTION. Volume of 2MHCl for trial 1 of your stock soiution Dispensette setting: 5.00mL Graduated cylinder reading: 5.1mL TABLE 1.2: TIME INFORMATION FOR THE DETERMINATION OF THE EFFECT OF CONCFNTRATION ON THE RATE OF REACTION. 1) Plot two graphs using the data from tables 1.1 and 1.2 using the average time: i) ln[C] vs t ii) 1/[C] vs t Prepare both graph according to the guidelines for making a graph on page 22. Include both graphs in your report. Refer to these two graphs to identify the reaction order and explain the selection. Refer to page 38 for the necessary concepts to determine the reaction order. First orde Reaction order: 2) Refer to the linear graph a second time to determine the rate constant. Remember that the rate constant can be calculated by using the slope of the curve. Show the calculation below. [A]1=[A0]1+ktSlope=x2x1y2yc1=c01+kt 1/c vs. Time(s)
Step by Step Solution
There are 3 Steps involved in it

Get step-by-step solutions from verified subject matter experts