

Question: Need help with a Write-up , please! Instructions for the write-up: Your write-up needs to address each the following area. Plainly label each section. Support
Need help with a Write-up, please!
Instructions for the write-up:
Your write-up needs to address each the following area. Plainly label each section. Support your observations with numbers from your ratios or directional (horizontal & vertical) financial statements. For example, if long term debt increased, what caused it? Do you see an increase in property & equipment? Has the interest expense increase? Has depreciation jumped significantly?
Your write-up needs an introduction about the company (Under Armour) and any major changes during the year.
Sales Growth Are Net Sales Growing? Are there any divisions, product lines or major category (such as online sales) growing? If the company has reail operations, is there an increase in same store sales? Has any stores been closed or product lines dropped? Does the annual report give any indication about the reason(s) for this? Does your directional analysis (horizontal or vertical) bear this out?
Cost Control are expenses in line with the change in net sales? Look at the levels of costs including cost of goods sold, and SGA (selling, general, and administrative expenses). Did any of these change more that would be expect given the sales increase? Were there any one time expenses? Do you find any explanation in the Management Discussion and Analysis (MDA) in the 10-K report? Again, support your observation with your directional analysis and/or ratios,
Profitability Look at the three levels of profits; gross margin, operating profit and net income. How are they changing from year to year as a percentage of sales (vertical analysis)? Is the profit changes in line with the sales changes?
Cash Flow and Liquidity - Is cash increasing or decreasing. Does that make sense in light of the profits? Look at the Statement of Cash Flows, Are all three categories generating cash? If cash from operation is negative, what is causes that? What about the liquidity ratios? Did you find a change in the current or the quick ratio? Is the growth of inventory reasonable as compared to the growing of cost of goods sold? Look at the inventory turnover ratio. And dont forget about accounts receivable and its change. Are you concerned with changes in the accounts receivable turnover ratio.
Debt Levels Is debt increasing or decreasing? Looks at the change in current and long-term liabilities in your directional analyses. What are the reasons for this change? Look at your debt ratios. If long term debt has increased, where are the funds being used, such as new equipment or to purchase a company? Is there anything in an annual report or outside articles to explain a significant change in debt, if you find one? If long term debt has increased, do you see a change in interest expense?
Equity and Stock Market Factors Has common stock plus the paid-in capital on common stock increased? Has it decreased from a buyback of common stock (treasury stock)? What about the price of the stock, has it changed significantly over the years of your analysis. Look at the price to earnings ratio and the dividend yield ratio.
You need to finish each write-up with a summary of your findings and concerns. What do you want your reader to continue to think about when they finish your write-up?
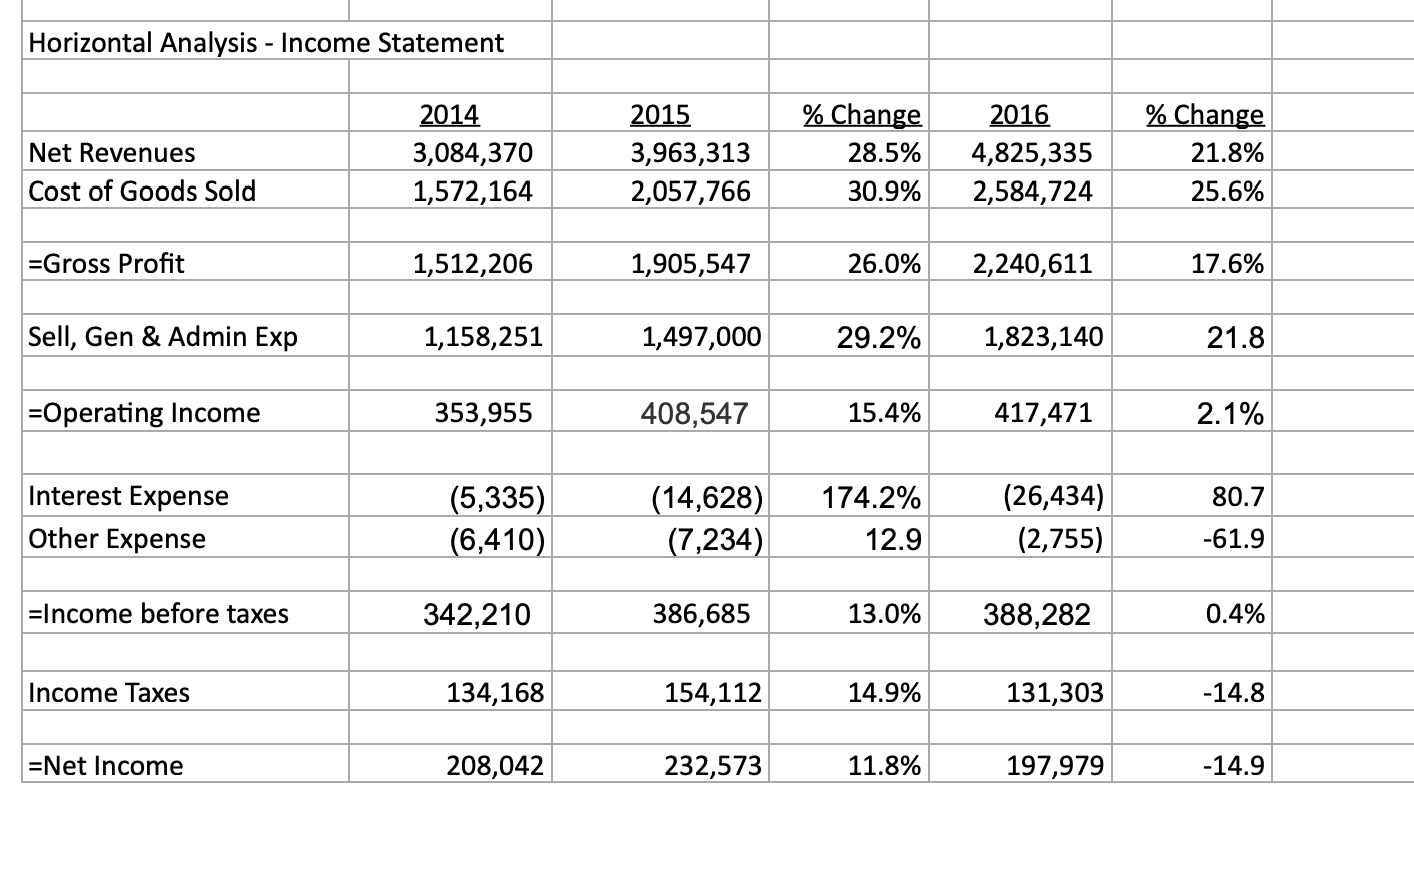
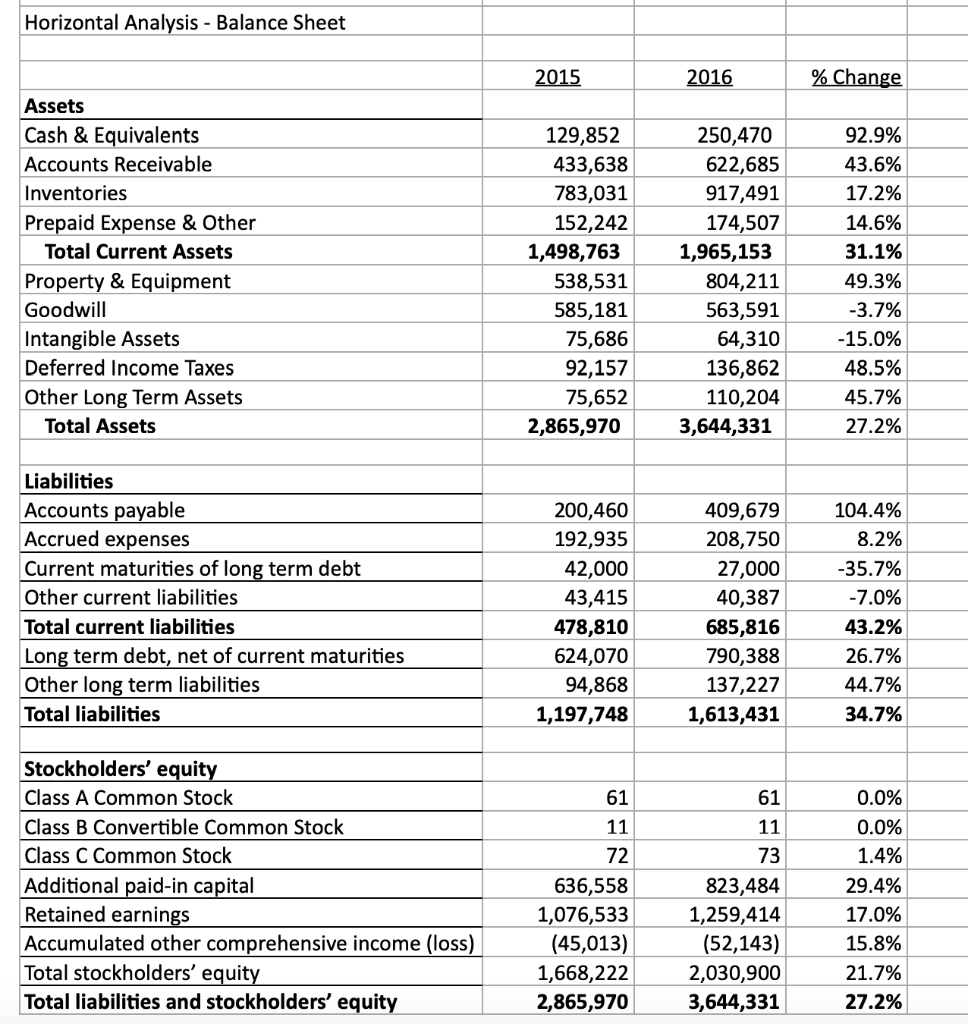
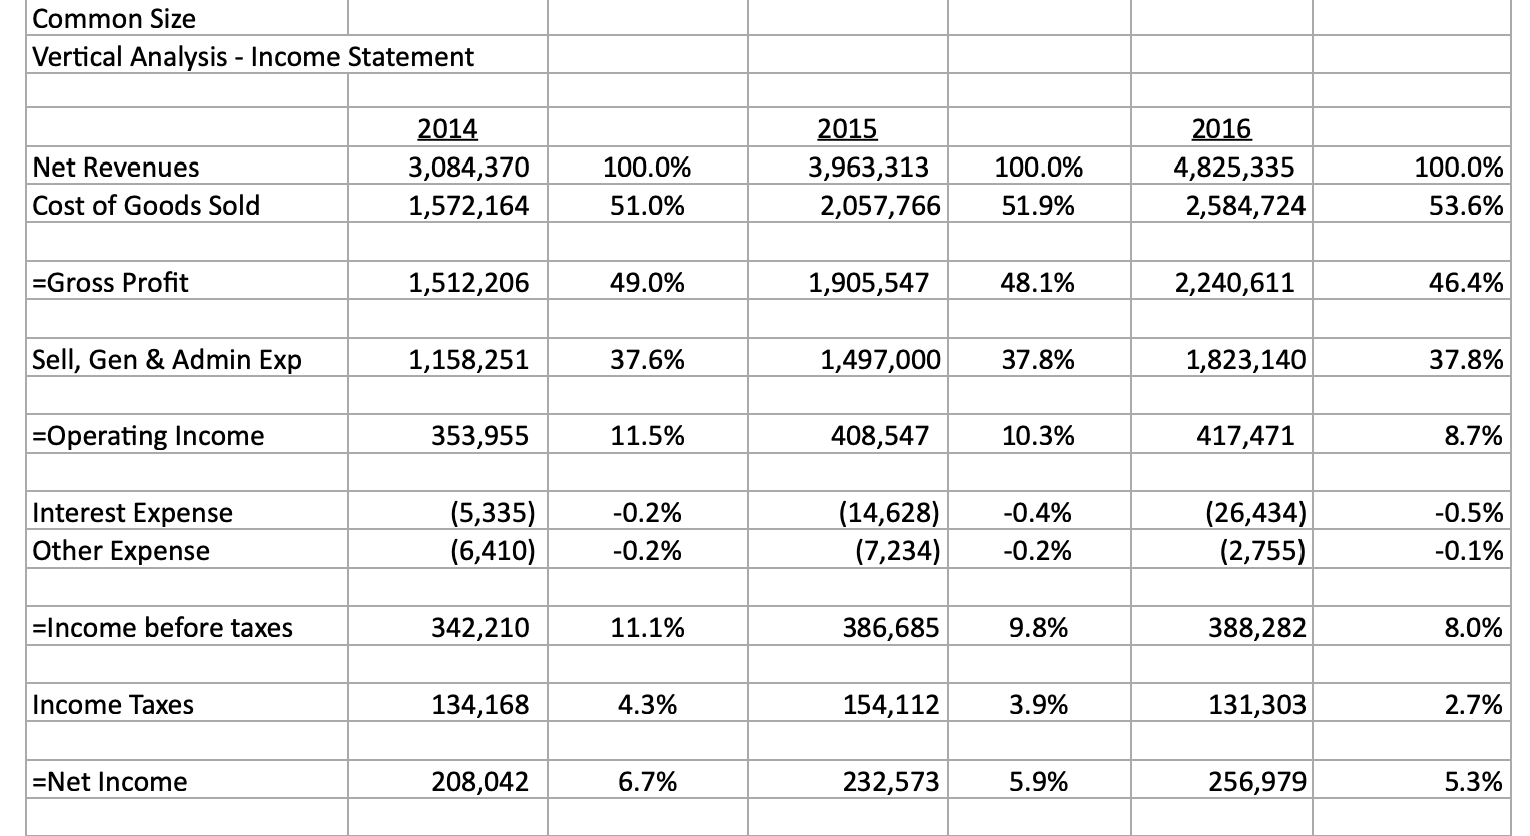
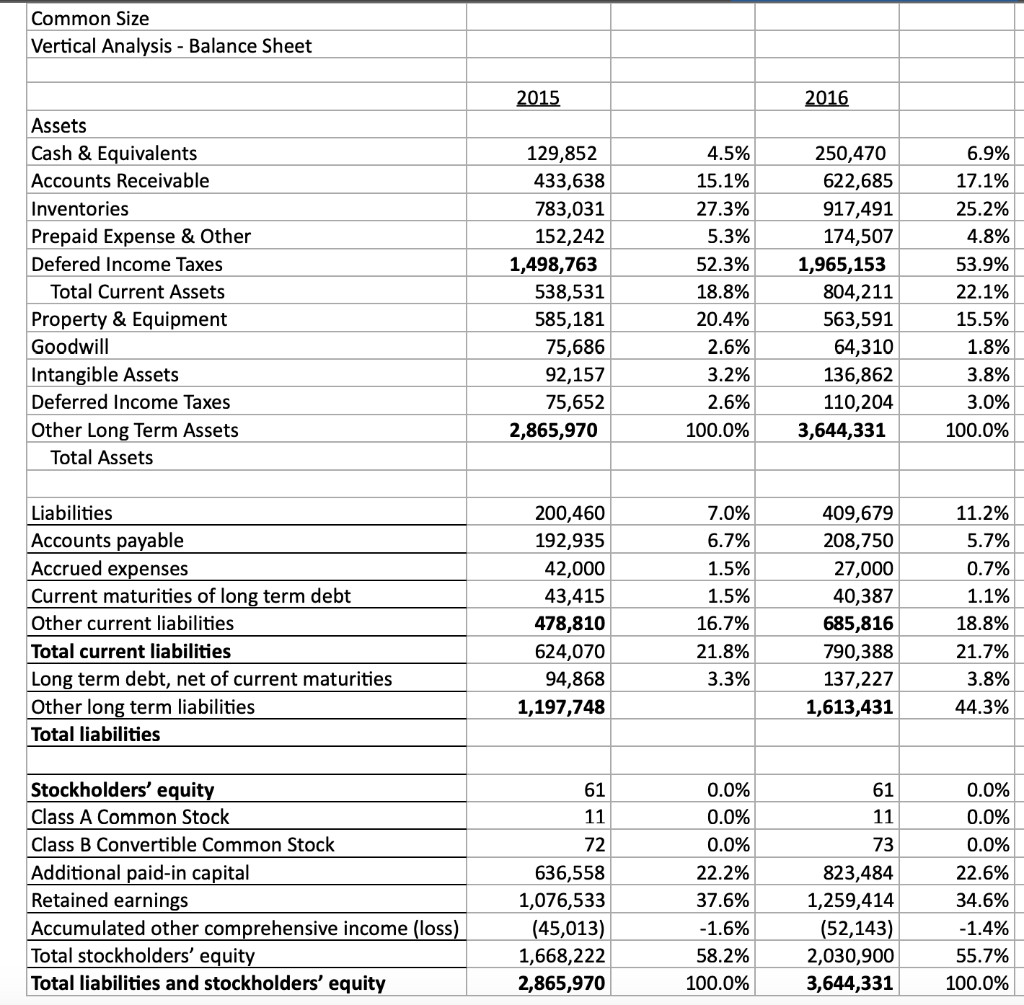
Horizontal Analysis - Income Statement Net Revenues Cost of Goods Sold 2014 3,084,370 1,572,164 2015 3,963,313 2,057,766 % Change 28.5% 30.9% 2016 4,825,335 2,584,724 % Change 21.8% 25.6% =Gross Profit 1,512,206 1,905,547 26.0% 2,240,611 17.6% Sell, Gen & Admin Exp 1,158,251 1,497,000 29.2% 1,823,140 21.8 =Operating Income 353,955 408,547 15.4% 417,471 2.1% 80.7 Interest Expense Other Expense (5,335) (6,410) (14,628) (7,234) 174.2% 12.9 (26,434) (2,755) -61.9 =Income before taxes 342,210 386,685 13.0% 388,282 0.4% Income Taxes 134,168 154,112 14.9% 131,303 -14.8 =Net Income 208,042 232,573 11.8% 197,979 -14.9 Horizontal Analysis - Balance Sheet 2015 2016 % Change Assets Cash & Equivalents Accounts Receivable Inventories Prepaid Expense & Other Total Current Assets Property & Equipment Goodwill Intangible Assets Deferred Income Taxes Other Long Term Assets Total Assets 129,852 433,638 783,031 152,242 1,498,763 538,531 585,181 75,686 92,157 75,652 2,865,970 250,470 622,685 917,491 174,507 1,965,153 804,211 563,591 64,310 136,862 110,204 3,644,331 92.9% 43.6% 17.2% 14.6% 31.1% 49.3% -3.7% -15.0% 48.5% 45.7% 27.2% 10 2 CA Liabilities Accounts payable Accrued expenses Current maturities of long term debt Other current liabilities Total current liabilities Long term debt, net of current maturities Other long term liabilities Total liabilities 200,460 192,935 42,000 43,415 478,810 624,070 94,868 1,197,748 409,679 208,750 27,000 40,387 685,816 790,388 137,227 1,613,431 104.4% 8.2% -35.7% -7.0% 43.2% 26.7% 44.7% 34.7% 61 61 11 11 72 73 Stockholders' equity Class A Common Stock Class B Convertible Common Stock Class C Common Stock Additional paid-in capital Retained earnings Accumulated other comprehensive income (loss) Total stockholders' equity Total liabilities and stockholders' equity 636,558 1,076,533 (45,013) 1,668,222 2,865,970 823,484 1,259,414 (52,143) 2,030,900 3,644,331 0.0% 0.0% 1.4% 29.4% 17.0% 15.8% 21.7% 27.2% Common Size Vertical Analysis - Income Statement Net Revenues Cost of Goods Sold 2014 3,084,370 1,572,164 100.0% 51.0% 2015 3,963,313 2,057,766 100.0% 51.9% 2016 4,825,335 2,584,724 100.0% 53.6% =Gross Profit 1,512,206 49.0% 1,905,547 48.1% 2,240,611 46.4% Sell, Gen & Admin Exp 1,158,251 37.6% 1,497,000 37.8% 1,823,140 37.8% =Operating Income 353,955 11.5% 408,547 10.3% 417,471 8.7% Interest Expense Other Expense (5,335) (6,410) -0.2% -0.2% (14,628) (7,234) -0.4% -0.2% (26,434) (2,755) -0.5% -0.1% =Income before taxes 342,210 11.1% 386,685 9.8% 388,282 8.0% Income Taxes 134,168 4.3% 154,112 3.9% 131,303 2.7% =Net Income 208,042 6.7% 232,573 5.9% 256,979 5.3% Common Size Vertical Analysis - Balance Sheet 2015 2016 Assets Cash & Equivalents Accounts Receivable Inventories Prepaid Expense & Other Defered Income Taxes Total Current Assets Property & Equipment Goodwill Intangible Assets Deferred Income Taxes Other Long Term Assets Total Assets 129,852 433,638 783,031 152,242 1,498,763 538,531 585,181 75,686 92,157 75,652 2,865,970 4.5% 15.1% 27.3% 5.3% 52.3% 18.8% 20.4% 2.6% 3.2% 2.6% 100.0% 250,470 622,685 917,491 174,507 1,965,153 804,211 563,591 64,310 136,862 110,204 3,644,331 6.9% 17.1% 25.2% 4.8% 53.9% 22.1% 15.5% 1.8% 3.8% 3.0% 100.0% Liabilities Accounts payable Accrued expenses Current maturities of long term debt Other current liabilities Total current liabilities Long term debt, net of current maturities Other long term liabilities Total liabilities 200,460 192,935 42,000 43,415 478,810 624,070 94,868 1,197,748 7.0% 6.7% 1.5% 1.5% 16.7% 21.8% 3.3% 409,679 208,750 27,000 40,387 685,816 790,388 137,227 1,613,431 11.2% 5.7% 0.7% 1.1% 18.8% 21.7% 3.8% 44.3% 61 61 11 73 Stockholders' equity Class A Common Stock Class B Convertible Common Stock Additional paid-in capital Retained earnings Accumulated other comprehensive income (loss) Total stockholders' equity Total liabilities and stockholders' equity 11 72 636,558 1,076,533 (45,013) 1,668,222 2,865,970 0.0% 0.0% 0.0% 22.2% 37.6% -1.6% 58.2% 100.0% 823,484 1,259,414 (52,143) 2,030,900 3,644,331 0.0% 0.0% 0.0% 22.6% 34.6% -1.4% 55.7% 100.0% Under Armour Inc. Ratio Analysis Formula 2014 2015 2016 2.87 Liquidity Ratio Current Ratio Quick Ratio Cash Flow Liquidity Ratio (Current Assets / Current Liability) (Current Assets - Inventory / Current Liability) (Cash & cash equialent+Market Sec.+ cash flow from operation/Current Liability) 3.13 1.49 1.53 0.19 9.14 47 Activity Ratio Acc. Receivable Turnover Ratio (Turnover /Average Acc. Receivable) Days Sales Outstanding (Account Receivable/(Sales/365) Inventory Turnover Ratio (Turnover /Average Inventory) Account Payable Turnover Ratio (Turnover /Account Payable) Days Payable outstanding (Account Payable/(Cost of Goods Sold/365) 9.14 40 5.06 19.77 35.56 5.68 15.82 57.85 Leverage Ratio Debt Ratio Debt to Equity Ratio Times interest Earned (Debt/Total Asset*100), here debt are Borrowing short and long term both (Total Liability/Shareholder's Equity)*100 (Earning before interest & tax / Interest) 23.24% 41.79% 27.43 22.43% 44.27% 15.69 Profitability Ratio Gross Profit Margin Operating Profit Mrgin Net Profit Margin Cash Flow Margin Return on total Assets Return on Equity (Gross Profit/Turnover), Turnover is Revenue (Operating Profit/Turnover) (Net Profit/Turnover) 49.03% 11.48% 6.75% 48.08% 10.31% 5.87% 46.43% 8.65% 5.33% Cash flow from operating activity / Net Turnover (Profit after Tax / Equity holder's Fund)*100 -0.00 12.65% 13.94% Market Ratio Earnign Per Share Perice to Earning Ratio Dividend Yield Proft after Tax / No. of shares Market Value per share/ EPS Dividend/Share price Cash Flow Liquidity Ratio =(129852-2405)/685816 = .19 256979 Cash flow fro operating activity for 2016: Income after Tax Change in working capital Change in Current Asssets =1498763-1965153 Change in Current Liability =685816-478810 -466390 207006 -2405 *Only ratio part solved Horizontal Analysis - Income Statement Net Revenues Cost of Goods Sold 2014 3,084,370 1,572,164 2015 3,963,313 2,057,766 % Change 28.5% 30.9% 2016 4,825,335 2,584,724 % Change 21.8% 25.6% =Gross Profit 1,512,206 1,905,547 26.0% 2,240,611 17.6% Sell, Gen & Admin Exp 1,158,251 1,497,000 29.2% 1,823,140 21.8 =Operating Income 353,955 408,547 15.4% 417,471 2.1% 80.7 Interest Expense Other Expense (5,335) (6,410) (14,628) (7,234) 174.2% 12.9 (26,434) (2,755) -61.9 =Income before taxes 342,210 386,685 13.0% 388,282 0.4% Income Taxes 134,168 154,112 14.9% 131,303 -14.8 =Net Income 208,042 232,573 11.8% 197,979 -14.9 Horizontal Analysis - Balance Sheet 2015 2016 % Change Assets Cash & Equivalents Accounts Receivable Inventories Prepaid Expense & Other Total Current Assets Property & Equipment Goodwill Intangible Assets Deferred Income Taxes Other Long Term Assets Total Assets 129,852 433,638 783,031 152,242 1,498,763 538,531 585,181 75,686 92,157 75,652 2,865,970 250,470 622,685 917,491 174,507 1,965,153 804,211 563,591 64,310 136,862 110,204 3,644,331 92.9% 43.6% 17.2% 14.6% 31.1% 49.3% -3.7% -15.0% 48.5% 45.7% 27.2% 10 2 CA Liabilities Accounts payable Accrued expenses Current maturities of long term debt Other current liabilities Total current liabilities Long term debt, net of current maturities Other long term liabilities Total liabilities 200,460 192,935 42,000 43,415 478,810 624,070 94,868 1,197,748 409,679 208,750 27,000 40,387 685,816 790,388 137,227 1,613,431 104.4% 8.2% -35.7% -7.0% 43.2% 26.7% 44.7% 34.7% 61 61 11 11 72 73 Stockholders' equity Class A Common Stock Class B Convertible Common Stock Class C Common Stock Additional paid-in capital Retained earnings Accumulated other comprehensive income (loss) Total stockholders' equity Total liabilities and stockholders' equity 636,558 1,076,533 (45,013) 1,668,222 2,865,970 823,484 1,259,414 (52,143) 2,030,900 3,644,331 0.0% 0.0% 1.4% 29.4% 17.0% 15.8% 21.7% 27.2% Common Size Vertical Analysis - Income Statement Net Revenues Cost of Goods Sold 2014 3,084,370 1,572,164 100.0% 51.0% 2015 3,963,313 2,057,766 100.0% 51.9% 2016 4,825,335 2,584,724 100.0% 53.6% =Gross Profit 1,512,206 49.0% 1,905,547 48.1% 2,240,611 46.4% Sell, Gen & Admin Exp 1,158,251 37.6% 1,497,000 37.8% 1,823,140 37.8% =Operating Income 353,955 11.5% 408,547 10.3% 417,471 8.7% Interest Expense Other Expense (5,335) (6,410) -0.2% -0.2% (14,628) (7,234) -0.4% -0.2% (26,434) (2,755) -0.5% -0.1% =Income before taxes 342,210 11.1% 386,685 9.8% 388,282 8.0% Income Taxes 134,168 4.3% 154,112 3.9% 131,303 2.7% =Net Income 208,042 6.7% 232,573 5.9% 256,979 5.3% Common Size Vertical Analysis - Balance Sheet 2015 2016 Assets Cash & Equivalents Accounts Receivable Inventories Prepaid Expense & Other Defered Income Taxes Total Current Assets Property & Equipment Goodwill Intangible Assets Deferred Income Taxes Other Long Term Assets Total Assets 129,852 433,638 783,031 152,242 1,498,763 538,531 585,181 75,686 92,157 75,652 2,865,970 4.5% 15.1% 27.3% 5.3% 52.3% 18.8% 20.4% 2.6% 3.2% 2.6% 100.0% 250,470 622,685 917,491 174,507 1,965,153 804,211 563,591 64,310 136,862 110,204 3,644,331 6.9% 17.1% 25.2% 4.8% 53.9% 22.1% 15.5% 1.8% 3.8% 3.0% 100.0% Liabilities Accounts payable Accrued expenses Current maturities of long term debt Other current liabilities Total current liabilities Long term debt, net of current maturities Other long term liabilities Total liabilities 200,460 192,935 42,000 43,415 478,810 624,070 94,868 1,197,748 7.0% 6.7% 1.5% 1.5% 16.7% 21.8% 3.3% 409,679 208,750 27,000 40,387 685,816 790,388 137,227 1,613,431 11.2% 5.7% 0.7% 1.1% 18.8% 21.7% 3.8% 44.3% 61 61 11 73 Stockholders' equity Class A Common Stock Class B Convertible Common Stock Additional paid-in capital Retained earnings Accumulated other comprehensive income (loss) Total stockholders' equity Total liabilities and stockholders' equity 11 72 636,558 1,076,533 (45,013) 1,668,222 2,865,970 0.0% 0.0% 0.0% 22.2% 37.6% -1.6% 58.2% 100.0% 823,484 1,259,414 (52,143) 2,030,900 3,644,331 0.0% 0.0% 0.0% 22.6% 34.6% -1.4% 55.7% 100.0% Under Armour Inc. Ratio Analysis Formula 2014 2015 2016 2.87 Liquidity Ratio Current Ratio Quick Ratio Cash Flow Liquidity Ratio (Current Assets / Current Liability) (Current Assets - Inventory / Current Liability) (Cash & cash equialent+Market Sec.+ cash flow from operation/Current Liability) 3.13 1.49 1.53 0.19 9.14 47 Activity Ratio Acc. Receivable Turnover Ratio (Turnover /Average Acc. Receivable) Days Sales Outstanding (Account Receivable/(Sales/365) Inventory Turnover Ratio (Turnover /Average Inventory) Account Payable Turnover Ratio (Turnover /Account Payable) Days Payable outstanding (Account Payable/(Cost of Goods Sold/365) 9.14 40 5.06 19.77 35.56 5.68 15.82 57.85 Leverage Ratio Debt Ratio Debt to Equity Ratio Times interest Earned (Debt/Total Asset*100), here debt are Borrowing short and long term both (Total Liability/Shareholder's Equity)*100 (Earning before interest & tax / Interest) 23.24% 41.79% 27.43 22.43% 44.27% 15.69 Profitability Ratio Gross Profit Margin Operating Profit Mrgin Net Profit Margin Cash Flow Margin Return on total Assets Return on Equity (Gross Profit/Turnover), Turnover is Revenue (Operating Profit/Turnover) (Net Profit/Turnover) 49.03% 11.48% 6.75% 48.08% 10.31% 5.87% 46.43% 8.65% 5.33% Cash flow from operating activity / Net Turnover (Profit after Tax / Equity holder's Fund)*100 -0.00 12.65% 13.94% Market Ratio Earnign Per Share Perice to Earning Ratio Dividend Yield Proft after Tax / No. of shares Market Value per share/ EPS Dividend/Share price Cash Flow Liquidity Ratio =(129852-2405)/685816 = .19 256979 Cash flow fro operating activity for 2016: Income after Tax Change in working capital Change in Current Asssets =1498763-1965153 Change in Current Liability =685816-478810 -466390 207006 -2405 *Only ratio part solved
Step by Step Solution
There are 3 Steps involved in it

Get step-by-step solutions from verified subject matter experts