

Question: Please write a write up for JCPenneys following these guidelines. I will post the financial data below. Your write-up needs to address each the following
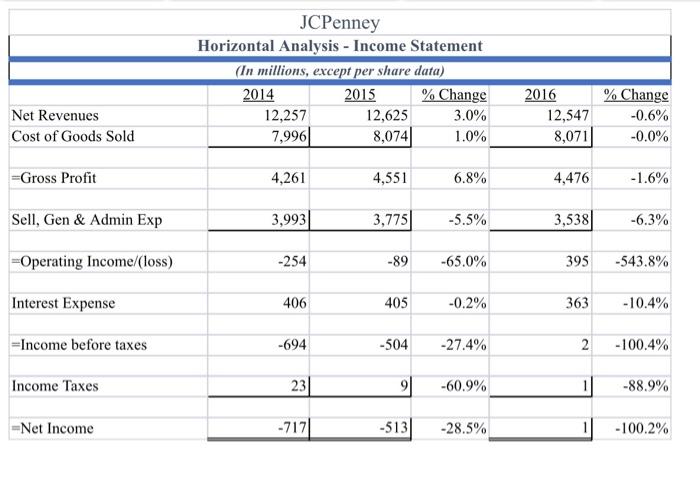
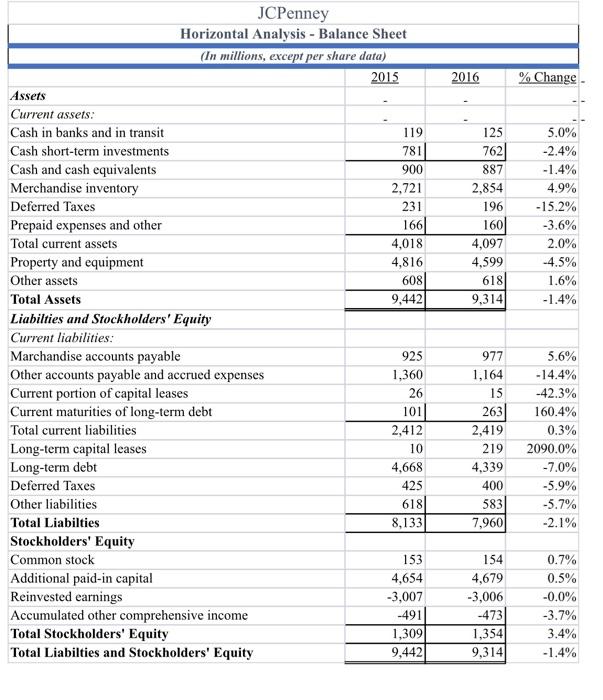
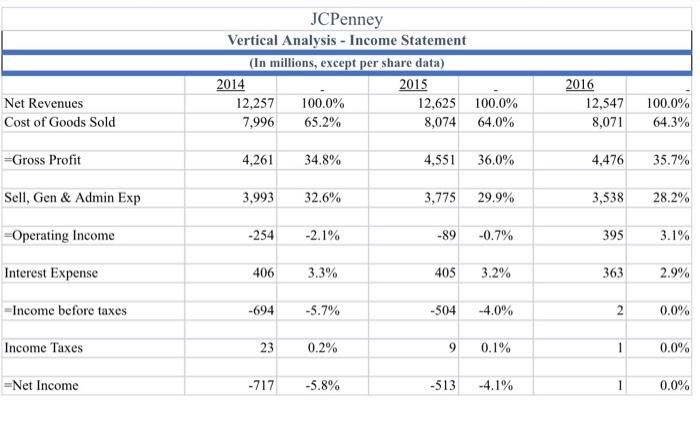
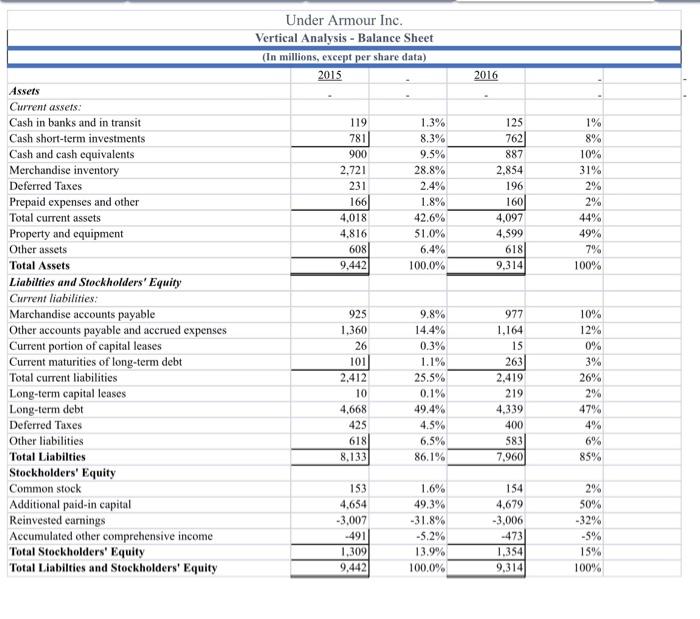
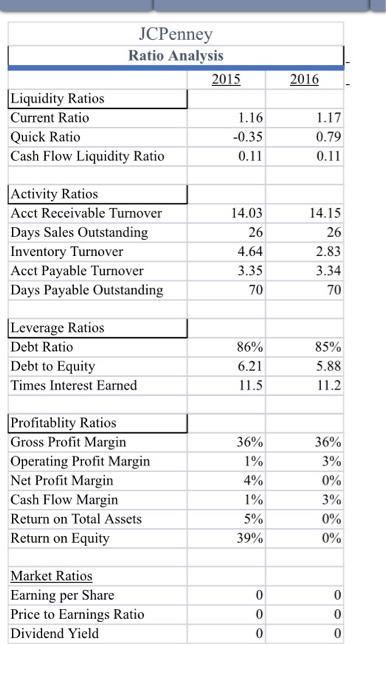
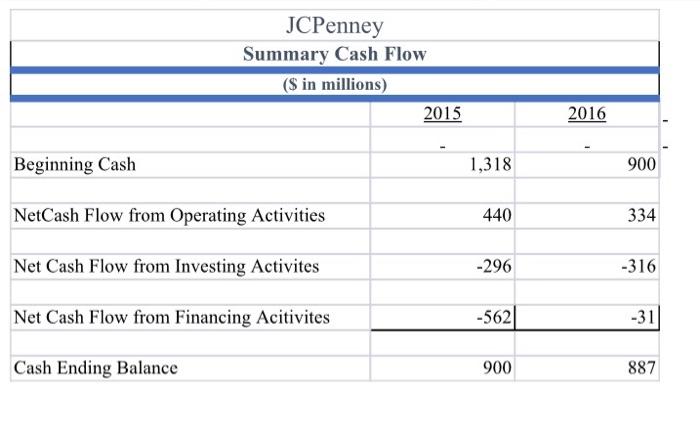
JCPenney Horizontal Analysis - Income Statement (In millions, except per share data) 2014 2015 % Change 12,257 12,625 3.0% 7,996 8,0741 1.0% Net Revenues Cost of Goods Sold 2016 12,547 8,071 % Change -0.6% -0.0% =Gross Profit 4,261 4,551 6.8% 4,476 -1.6% Sell, Gen & Admin Exp 3,993 3,7751 -5.5% 3,538) -6.3% -Operating Income/loss) -254 -89 -65.0% 395 -543.8% Interest Expense 406 405 -0.2% 363 -10.4% =Income before taxes -694 -504 -27.4% 2 -100.4% Income Taxes 23 91 -60.9% 1 -88.9% -Net Income -7171 -5131 -28.5% 1 -100.2% 2016 % Change 119 125 762 887 2,854 196 160 4,097 4,599 618 9,314 5.0% -2.4% -1.4% 4.9% -15.2% -3.6% 2.0% -4.5% 1.6% -1.4% JCPenney Horizontal Analysis - Balance Sheet (In millions, except per share data) 2015 Assets Current assets: Cash in banks and in transit Cash short-term investments 781 Cash and cash equivalents 900 Merchandise inventory 2,721 Deferred Taxes 231 Prepaid expenses and other 1661 Total current assets 4,018 Property and equipment 4,816 Other assets 608 Total Assets 9,442 Liabilties and Stockholders' Equity Current liabilities: Marchandise accounts payable 925 Other accounts payable and accrued expenses 1,360 Current portion of capital leases 26 Current maturities of long-term debt 101 Total current liabilities 2,412 Long-term capital leases 10 Long-term debt 4,668 Deferred Taxes 425 Other liabilities 618 Total Liabilties 8,133 Stockholders' Equity Common stock 153 Additional paid-in capital 4,654 Reinvested earnings -3,007 Accumulated other comprehensive income -491 Total Stockholders' Equity 1,3091 Total Liabilties and Stockholders' Equity 9,442 977 1,164 15 263 2,419 219 4,339 400 5831 7,960 5.6% -14.4% -42.3% 160.4% 0.3% 2090.0% -7.0% -5.9% -5.7% -2.1% 154 4,679 -3,006 -473 1,354 9,314 0.7% 0.5% -0.0% -3.7% 3.4% -1.4% JCPenney Vertical Analysis - Income Statement (In millions, except per share data) 2014 2015 12,257 100.0% 12,625 7,996 65.2% 8,074 Net Revenues Cost of Goods Sold 100.0% 64.0% 2016 12,547 8,071 100.0% 64.3% =Gross Profit 4,261 34.8% 4,551 36.0% 4,476 35.7% Sell, Gen & Admin Exp 3,993 32.6% 3,775 29.9% 3,538 28.2% =Operating Income -254 -2.1% -89 -0.7% 395 3.1% Interest Expense 406 3.3% 405 3.2% 363 2.9% -Income before taxes -694 -5.7% -504 -4.0% 2 0.0% Income Taxes 23 0.2% 9 0.1% 1 0.0% =Net Income -717 -5.8% -513 -4.1% 1 0.0% Under Armour Inc. Vertical Analysis - Balance Sheet (In millions, except per share data) 2015 2016 119 781 900 2.721 231 166 4,018 4.816 608 9,442 1.3% 8.3% 9.5% 28.8% 2.4% 1.8% 42.6% 51.0% 6.4% 100.0% 125 762 887 2,854 196 160 4,097 4.599 6181 9,314 1% 8% 10% 31% 2% 2% 44% 49% 7% 100% Assets Current assets: Cash in banks and in transit Cash short-term investments Cash and cash equivalents Merchandise inventory Deferred Taxes Prepaid expenses and other Total current assets Property and equipment Other assets Total Assets Liabilties and Stockholders' Equity Current liabilities: Marchandise accounts payable Other accounts payable and accrued expenses Current portion of capital leases Current maturities of long-term debt Total current liabilities Long-term capital leases Long-term debt Deferred Taxes Other liabilities Total Liabilties Stockholders' Equity Common stock Additional paid-in capital Reinvested earnings Accumulated other comprehensive income Total Stockholders' Equity Total Liabilties and Stockholders' Equity 925 1,360 26 101 2,412 10 4,668 425 618 8.133 9.8% 14.4% 0.3% 1.1% 25.5% 0.1% 49.4% 4.5% 6.5% 86.1% 977 1,164 15 263 2.419 219 4,339 400 583 7,960 10% 12% 0% 3% 26% 2% 47% 4% 6% 85% 154 4,679 -3,006 153 4,654 -3.007 -491 1,309 9,442 1.6% 49.3% -31.8% -5.2% 13.9% 100.0% -473 90 470 50% -32% -5% 15% 100% 1.354 9,314 2016 JCPenney Ratio Analysis 2015 Liquidity Ratios Current Ratio 1.16 Quick Ratio -0.35 Cash Flow Liquidity Ratio 0.11 1.17 0.79 0.11 Activity Ratios Acct Receivable Turnover Days Sales Outstanding Inventory Turnover Acct Payable Turnover Days Payable Outstanding 14.03 26 4.64 3.35 70 14.15 26 2.83 3.34 70 Leverage Ratios Debt Ratio Debt to Equity Times Interest Earned 86% 6.21 11.5 85% 5.88 11.2 36% 3% Profitablity Ratios Gross Profit Margin Operating Profit Margin Net Profit Margin Cash Flow Margin Return on Total Assets Return on Equity 0% 36% 1% 4% 1% 5% 39% 3% 0% 0% 0 Market Ratios Earning per Share Price to Earnings Ratio Dividend Yield 0 0 OOO 0 JCPenney Summary Cash Flow ($ in millions) 2015 2016 Beginning Cash 1,318 900 NetCash Flow from Operating Activities 440 334 Net Cash Flow from Investing Activites -296 -316 Net Cash Flow from Financing Acitivites -562 -31 Cash Ending Balance 900 887
Step by Step Solution
There are 3 Steps involved in it

Get step-by-step solutions from verified subject matter experts