

Question: Need Help with B1. Thank You. Appendix A Specimen Financial Statements: Apple Inc. Chartered the hope Martino fummation of which is The prepared by the
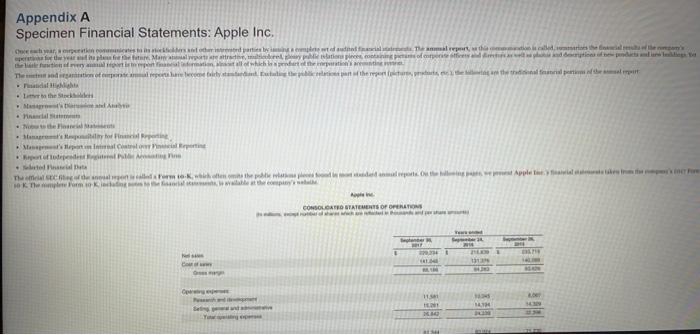
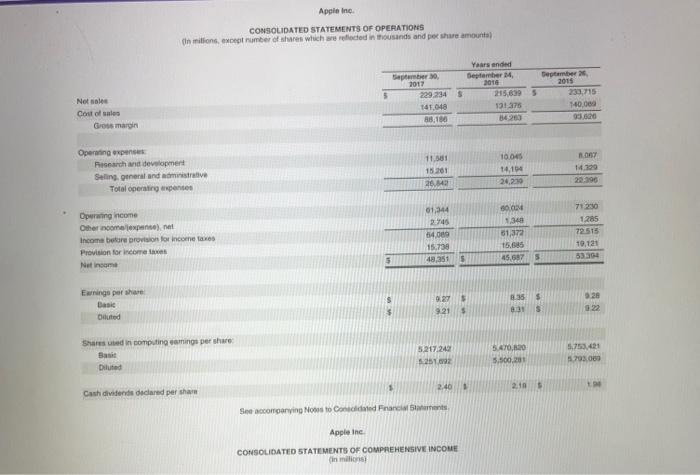
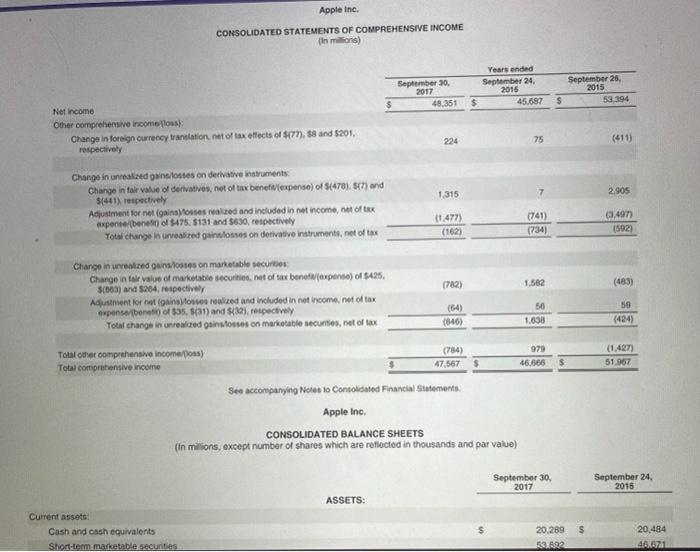
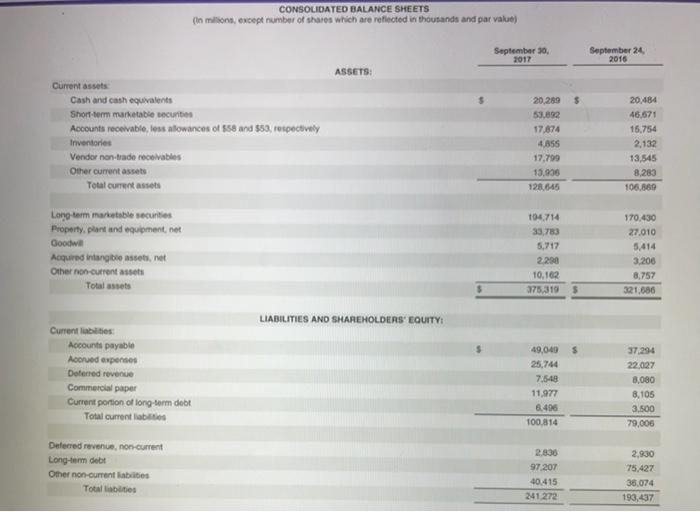
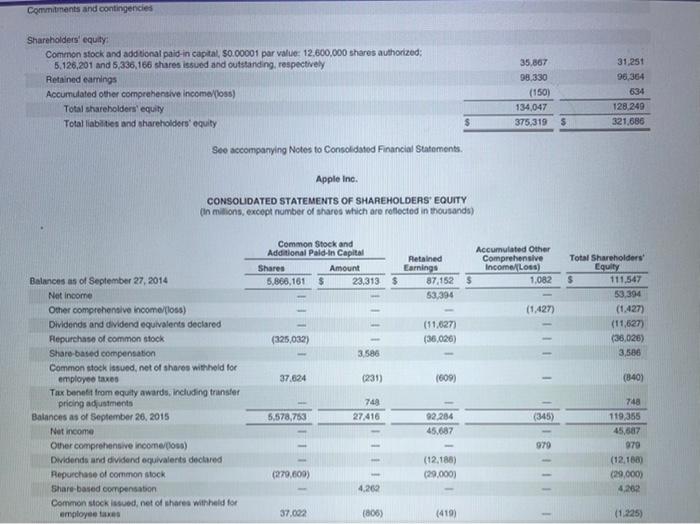
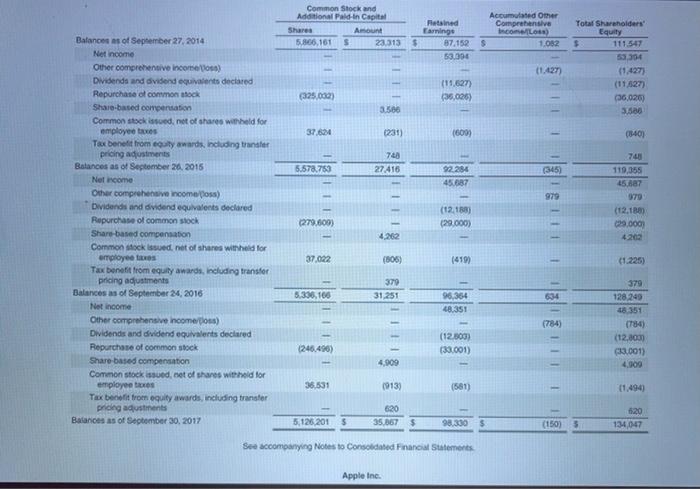
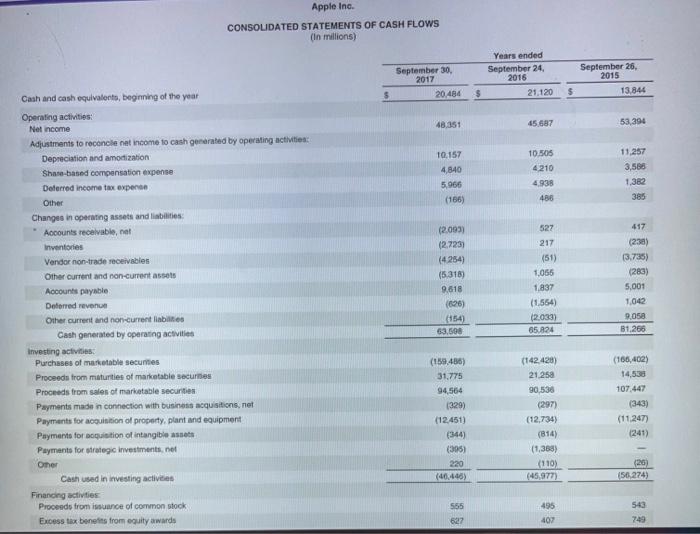
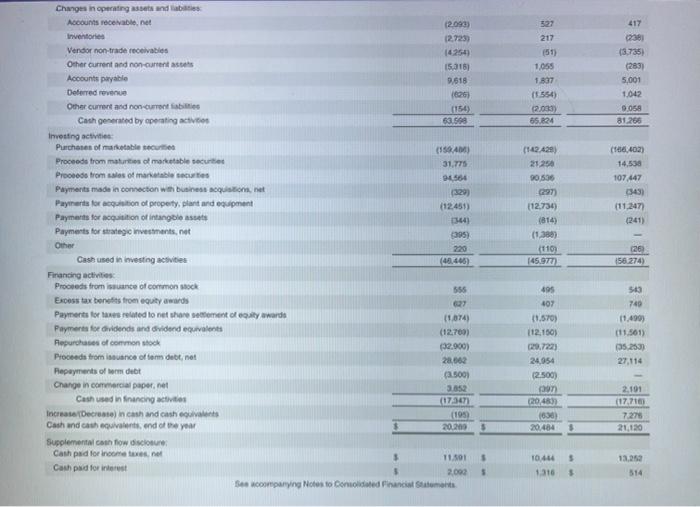
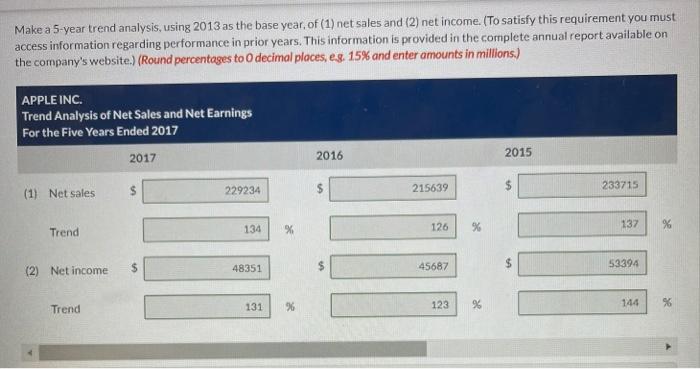
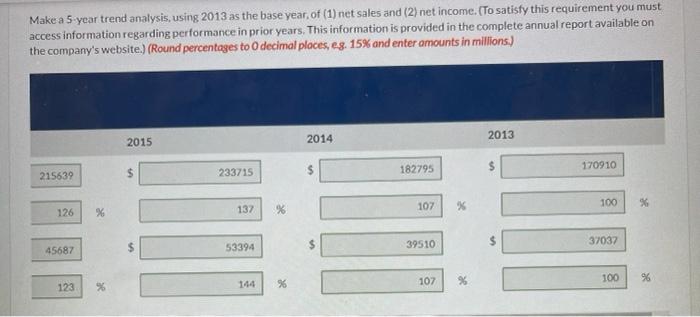
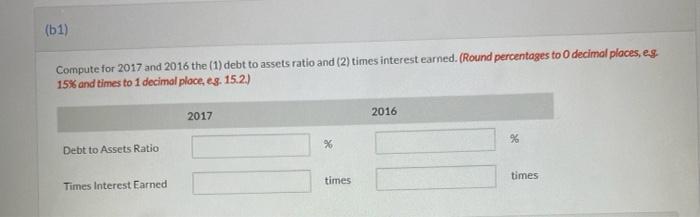
Appendix A Specimen Financial Statements: Apple Inc. Chartered the hope Martino fummation of which is The prepared by the rest etiam . the St . . y todo . M'esti pred . Thermowells OW Apple K Theme forma watcom CONSOLATO STATEMENTS OF OPERATIONS 11 Appleine CONSOLIDATED STATEMENTS OF OPERATIONS inition, except number of shares which we reeded in thousands and preshare amount Yaars ended September 30, September 2017 2010 229 2345 215.6395 141048 191375 88.100 84200 September 2015 230,715 140.000 5 Net sole Cost of sales Gros margin Operating expenses Research wid devlopment Seling general and me Total operating expenses 11.581 15201 26.12 10.04 14.14 24,200 RORY 1700 22,390 Operating income Other compense.net Income before provision for income taxes Provision for income Netiname 01,344 2.745 6400 15.738 435 SOOM 34 61,372 15,685 71 2:30 1.285 72 515 10.121 53300 $ 0 45.687 5 $ $ Eringe per share Basic Diluted 9.27 921 35 831 9.28 922 Share din computing comings per share 5.217.248 5.251 5.470,120 5.500 5.753.41 70.000 Diluted 1 2.40 20 Cash dividends declared per sham See accompanying Notes to Condated Financialment Appleine CONSOLIDATED STATEMENTS OF COMPREHENSIVE INCOME in milions Apple Inc. CONSOLIDATED STATEMENTS OF COMPREHENSIVE INCOME In millions September 30, 2017 48,351 Years ended September 24, 2016 45.687 September 26, 2015 53,394 $ $ $ Net Income Other comprehensive income ou Change in foreign currency translation net of tax effects of $(77) $8 and 5201 rospectively 224 75 1.315 7 2.905 Change in unrealized and tosses on derivative Instruments Change in tair value of derivatives, net of tax benefexpense) of $(478). 57) and $(441), respectively Adjustment for net(gaisses realized and included in income, et of tak experte bene of $475.5131 and 5630, respectively Total change in urma redisses on derivative Instruments, net of tax (1.477) (162) (741) (734) 2.497 (5921 (782) 1.582 (483) Change in unrealized intes on marketable securities Change in tale value of marketable securities, net of tax benef/expense) of 5425 $(603) and $264, respectively Adustment for not gainosso realized and included in net income, net of tax expensabone of $35 (31) and 5482), respectively Total change in realized intossos on marketable secums, net of tax (64) (846) 56 1.638 50 (424) (1.427) 51.967 Total et comprehensive income Doss) (784) 979 Total competensive income 47.567 46.686 See accompanying Notes to Consolidated Financial Statements. Apple Inc. CONSOLIDATED BALANCE SHEETS (in Millions, except number of shares which are reflected in thousands and par value) September 30, 2017 September 24, 2015 ASSETS: Current assots: Cash and cash equivalents Short-term marketable secunties s 20.289 53.22 20,484 AZ CONSOLIDATED BALANCE SHEETS (In milions, except number of shares which are reflected in thousands and par vake) September 30, 2017 September 24 2016 ASSETS: 20.484 46.671 15,754 Current assets Cash and cash equivalents Short-term marketable securities Accounts receivable, tous allowances of 858 and $53, respectively Inventories Vendor non-trade receivables Other current assets Total current assets 20.289 53.892 17.874 4,855 17.799 13.900 128.645 2,132 13,545 8.283 106,869 170.430 27.010 Long-term marketable securities Property, plant and equipment, net Goodwill Acquired intangible assets.net Other non current assets Total assets 5,414 104.714 33,783 5,717 2.290 10.162 375.319 3.200 8.757 321.686 5 LIABILITIES AND SHAREHOLDERS' EQUITY: 5 Current abilities Accounts payable Acord expenses Dotarred revenue Commercial paper Current portion of long-term debe Total current liabilities 49,049 25.744 7,519 11.977 6.490 100,814 37.294 22.027 8,080 8,105 3.500 79,000 Deferred revenue, non-current Long-term debt Other non-current les Totalities 2,830 97 207 40.415 241 272 2,830 75,427 35.074 193,437 Commitments and contingencies Shareholders' equity Comenon stock and add tonal paid in capital, 50.00001 par value: 12.600.000 shares authorized: 5,126,201 and 5,336,166 shares issued and outstanding, respectively Retained earnings Accumulated other comprehensive income (los) Total shareholders' equity Total liabilities and shareholders' equity 35,867 98,330 (150) 134,047 375,319 31.251 96,364 634 128,249 321.686 $ $ See accompanying Notes to Consolidated Financial Statements. Apple Inc. CONSOLIDATED STATEMENTS OF SHAREHOLDERS' EQUITY (in milions, except number of shares which are reflected in thousands) Common Stock and Additional Pald-in Capital Shares Amount 5,866,161 $ 23,313 $ Accumulated Other Retained Comprehensive Earnings Income Loss) 87.152 $ 1,082 53,396 (1.427) (11.0271 (36,026) Total Shareholders Equity $ 111,547 53,394 (1.427) (11,627) (38,026) 3,580 (325,032) 3.586 37.624 (231) (609) (340) Balances as of September 27, 2014 Net Income Other comprehensive income (los) Dividends and dividend equivalents declared Repurchase of common stock Share based compensation Common stock lesund, net of shares with hold for employee taxes Tax benefit from equity awards, including transfer pricing adjustments Balances as of September 28, 2015 Not income Other comprehensive income (ou) Dividends and dividend equivalents declared Repurchase of common stock Share based compensation Common stock issued, net of shares withheld for employee taxes 748 27.416 5,578,753 (345) 92.284 45.687 979 748 119,355 45,587 970 (12.168) (29.000) 4,262 (12,180) (29.000) (270.600) 4,262 37.002 (806) (419) (1.225) Common Stock and Additional Pald-in Capital Shares Amount 5.866.161 S 23.315 Retained Earnings $ 87.152 53.000 Accumulated Other Comprehensive Income $ 1,082 (1.427) Total Shareholders Equity $ 111.547 53,304 (1.427) (11.527) (36,026 3.580 (325.000) (11.627 (36,026) 3.500 37.624 (231) 1600) (340) 740 74 5.578.753 27416 (345) 92.24 45.687 979 119,355 45.687 970 (12.18 29.000 (279.600) (12.183) (29.000) Balance of September 27, 2014 Net Income Other comprehensive incoros) Dividends and dividend equivalent declared Repurchase of common stock Share-based compensation Common stack swed, net of shares with held for employee taxes Tax benefit from egy awards, including transfer pricing adjustments Balances as of September 26, 2015 Net income Other comprehensive income foss) Dividends and dividend equivalent declared Repurchase of common stock Share-based compensation Common stock issued, net of shares with held for employees Tax benefit from equity awards, including transfer pricing adustments Balances as of September 26, 2016 Net income Other comprehensive income) Dividends and dividend equivalents declared Repurchase of common stock Share-based compensation Common stock issued, net of shares withold for employees Tax become from equity awards, including transfer pricing austments Balances as of September 30, 2017 4.262 37.022 (805) (419 379 31.251 5,305,106 634 96,364 48.351 (784) 379 128 249 48 351 (784) (12,8001 (33.001) 4909 (246.496) (12,500) 133,001) 4.909 36,531 (913) (581) 01.494) 620 35.3675 5,126, 2015 98.330 620 134,047 $ (150) 3 See accompanying Notes to Consoldated Financial Statements Apple Inc. Apple Inc. CONSOLIDATED STATEMENTS OF CASH FLOWS (in Millions) September 30, 2017 20.484 Years ended September 24, 2016 21.120 September 26, 2015 13,844 5 $ 48.351 45.687 53,394 10,157 4,840 5,966 (166) 10.505 4210 4938 11.257 3,565 1.382 385 486 527 217 (51) Cash and cash equivalents, beginning of the year Operating activities: Net Income Adjustments to reconcile net income to cash generated by operating activities: Depreciation and amodization Share-based compensation expense Deferred income tax expense Other Changes in operating assets and liabilities: Accounts receivable, nel Inventories Vendor non-trade receivables Other current and non-current assets Accounts payable Deferred revenue Other current and non-current liabilities Cash generated by operating activities Investing activities Purchases of marketable securities Proceeds from maturities of marketable securines Proceeds from sales of marketable securities Payments made in connection with business acquisitions, net Payments for acquisition of property, plant and equipment Payments for adquisition of intangible asset Payments for strategic Investments.net Omer Cash used in investing activities Financing activities Proceeds from issuance of common stock Excess tax benefits from equity awards (2.000) (2.723) (4254) (5.318) 9.618 (626) (154) 63.500 1,055 1837 (1.554) (2,033) 65.824 417 (230) (3.735) (283) 5,000 1,042 9.05 31.265 (158,456) 31.775 94,564 (165,402) 14,530 107,447 (343) (11.247) (241) (329) (142.428) 21.25 90,530 (297) (12,734) (814) (1.383) (110) (45,977) (12.451) (344) (395) 220 (46.440) (26) (56,274) 555 627 495 407 543 249 527 217 151) 1.055 417 238 (3.735) (283) 5,001 1.042 0.058 81.265 1.837 (1554) (2003) 65.824 (402) 14,530 107447 3451 (11.2477 (241) 1329 Changes in operating assets and be Accounts receivable.net (2093) Inventore (2.7239 Vendor non-trade receivables Other current and non-currentes 15.018) Accounts payable 9,618 Deferred revenue 1626) Other current and noncurabite (154) Cash generated by operating activ 63.560 Investing activities Purchases of marketables (558) Proceeds from maturties of marketable securitie 31.775 Proceeds from sales of marble secure 26564 Payments made in connection with business acquisitions, net Payments for action of property, plant and equipment 112459) Payments for acquisition of intangible asset 1344) Payments for strategic investments, net (395) Other 220 Cast used in investing activities (40.465) Financing activities Prooveds from issuance of common stock 555 Excess tax benefits from equity awards Payments fortes related to net share soment of equity wards (1.674) Payment for dividends and vidend equivalent (12.700) Riepurchases of common stock (32.900) Proceeds from souance of tem debt, net 28.062 Repayments of term debt (2500) Change in commercial paper, net Cas used in financing activities (17347 Increase/Decrease in cash and cash equivos (195 Cash and cashev end of the year 20200 Supplement conflow disclosure Cashpad for income are not 3 11.30 Cash paid for interest 2.000 Se companying Notes to consolidated Financial Statements (142420) 21.254 90 536 297) 112.736) (814) (1.30) (1109 145.977 26 156.274) 495 407 11.570) 112.150) 20.722) 24,954 (2.500) 543 740 11.499) (11.561) 35.2530 27.114 (20.483 (630) 20.484 2.100 (17.710 7.276 21.120 $ S $ 10.444 1310 13.252 514 5 s Make a 5-year trend analysis, using 2013 as the base year, of (1) net sales and (2) net income. (To satisfy this requirement you must access information regarding performance in prior years. This information is provided in the complete annual report available on the company's website.) (Round percentages to O decimal places, eg, 15% and enter amounts in millions.) APPLE INC. Trend Analysis of Net Sales and Net Earnings For the Five Years Ended 2017 2017 2016 2015 $ 229234 215639 233715 (1) Net sales 134 126 Trend % 137 % $ (2) Net income 48351 45687 53394 Trend 131 % 123 % 144 Make a 5-year trend analysis, using 2013 as the base year, of (1) net sales and (2) net income. (To satisfy this requirement you must access information regarding performance in prior years. This information is provided in the complete annual report available on the company's website.) (Round percentages to O decimal places, eg. 15% and enter amounts in millions.) 2015 2014 2013 $ $ 170910 215639 233715 182795 107 100 126 137 X %6 % 39510 37037 45687 53394 107 100 % %6 123 144 %6 % % (51) Compute for 2017 and 2016 the (1) debt to assets ratio and (2) times interest earned. (Round percentages to decimal places, es 15% and times to 1 decimal place, eg. 152) 2017 2016 % % Debt to Assets Ratio times times Times Interest Earned Appendix A Specimen Financial Statements: Apple Inc. Chartered the hope Martino fummation of which is The prepared by the rest etiam . the St . . y todo . M'esti pred . Thermowells OW Apple K Theme forma watcom CONSOLATO STATEMENTS OF OPERATIONS 11 Appleine CONSOLIDATED STATEMENTS OF OPERATIONS inition, except number of shares which we reeded in thousands and preshare amount Yaars ended September 30, September 2017 2010 229 2345 215.6395 141048 191375 88.100 84200 September 2015 230,715 140.000 5 Net sole Cost of sales Gros margin Operating expenses Research wid devlopment Seling general and me Total operating expenses 11.581 15201 26.12 10.04 14.14 24,200 RORY 1700 22,390 Operating income Other compense.net Income before provision for income taxes Provision for income Netiname 01,344 2.745 6400 15.738 435 SOOM 34 61,372 15,685 71 2:30 1.285 72 515 10.121 53300 $ 0 45.687 5 $ $ Eringe per share Basic Diluted 9.27 921 35 831 9.28 922 Share din computing comings per share 5.217.248 5.251 5.470,120 5.500 5.753.41 70.000 Diluted 1 2.40 20 Cash dividends declared per sham See accompanying Notes to Condated Financialment Appleine CONSOLIDATED STATEMENTS OF COMPREHENSIVE INCOME in milions Apple Inc. CONSOLIDATED STATEMENTS OF COMPREHENSIVE INCOME In millions September 30, 2017 48,351 Years ended September 24, 2016 45.687 September 26, 2015 53,394 $ $ $ Net Income Other comprehensive income ou Change in foreign currency translation net of tax effects of $(77) $8 and 5201 rospectively 224 75 1.315 7 2.905 Change in unrealized and tosses on derivative Instruments Change in tair value of derivatives, net of tax benefexpense) of $(478). 57) and $(441), respectively Adjustment for net(gaisses realized and included in income, et of tak experte bene of $475.5131 and 5630, respectively Total change in urma redisses on derivative Instruments, net of tax (1.477) (162) (741) (734) 2.497 (5921 (782) 1.582 (483) Change in unrealized intes on marketable securities Change in tale value of marketable securities, net of tax benef/expense) of 5425 $(603) and $264, respectively Adustment for not gainosso realized and included in net income, net of tax expensabone of $35 (31) and 5482), respectively Total change in realized intossos on marketable secums, net of tax (64) (846) 56 1.638 50 (424) (1.427) 51.967 Total et comprehensive income Doss) (784) 979 Total competensive income 47.567 46.686 See accompanying Notes to Consolidated Financial Statements. Apple Inc. CONSOLIDATED BALANCE SHEETS (in Millions, except number of shares which are reflected in thousands and par value) September 30, 2017 September 24, 2015 ASSETS: Current assots: Cash and cash equivalents Short-term marketable secunties s 20.289 53.22 20,484 AZ CONSOLIDATED BALANCE SHEETS (In milions, except number of shares which are reflected in thousands and par vake) September 30, 2017 September 24 2016 ASSETS: 20.484 46.671 15,754 Current assets Cash and cash equivalents Short-term marketable securities Accounts receivable, tous allowances of 858 and $53, respectively Inventories Vendor non-trade receivables Other current assets Total current assets 20.289 53.892 17.874 4,855 17.799 13.900 128.645 2,132 13,545 8.283 106,869 170.430 27.010 Long-term marketable securities Property, plant and equipment, net Goodwill Acquired intangible assets.net Other non current assets Total assets 5,414 104.714 33,783 5,717 2.290 10.162 375.319 3.200 8.757 321.686 5 LIABILITIES AND SHAREHOLDERS' EQUITY: 5 Current abilities Accounts payable Acord expenses Dotarred revenue Commercial paper Current portion of long-term debe Total current liabilities 49,049 25.744 7,519 11.977 6.490 100,814 37.294 22.027 8,080 8,105 3.500 79,000 Deferred revenue, non-current Long-term debt Other non-current les Totalities 2,830 97 207 40.415 241 272 2,830 75,427 35.074 193,437 Commitments and contingencies Shareholders' equity Comenon stock and add tonal paid in capital, 50.00001 par value: 12.600.000 shares authorized: 5,126,201 and 5,336,166 shares issued and outstanding, respectively Retained earnings Accumulated other comprehensive income (los) Total shareholders' equity Total liabilities and shareholders' equity 35,867 98,330 (150) 134,047 375,319 31.251 96,364 634 128,249 321.686 $ $ See accompanying Notes to Consolidated Financial Statements. Apple Inc. CONSOLIDATED STATEMENTS OF SHAREHOLDERS' EQUITY (in milions, except number of shares which are reflected in thousands) Common Stock and Additional Pald-in Capital Shares Amount 5,866,161 $ 23,313 $ Accumulated Other Retained Comprehensive Earnings Income Loss) 87.152 $ 1,082 53,396 (1.427) (11.0271 (36,026) Total Shareholders Equity $ 111,547 53,394 (1.427) (11,627) (38,026) 3,580 (325,032) 3.586 37.624 (231) (609) (340) Balances as of September 27, 2014 Net Income Other comprehensive income (los) Dividends and dividend equivalents declared Repurchase of common stock Share based compensation Common stock lesund, net of shares with hold for employee taxes Tax benefit from equity awards, including transfer pricing adjustments Balances as of September 28, 2015 Not income Other comprehensive income (ou) Dividends and dividend equivalents declared Repurchase of common stock Share based compensation Common stock issued, net of shares withheld for employee taxes 748 27.416 5,578,753 (345) 92.284 45.687 979 748 119,355 45,587 970 (12.168) (29.000) 4,262 (12,180) (29.000) (270.600) 4,262 37.002 (806) (419) (1.225) Common Stock and Additional Pald-in Capital Shares Amount 5.866.161 S 23.315 Retained Earnings $ 87.152 53.000 Accumulated Other Comprehensive Income $ 1,082 (1.427) Total Shareholders Equity $ 111.547 53,304 (1.427) (11.527) (36,026 3.580 (325.000) (11.627 (36,026) 3.500 37.624 (231) 1600) (340) 740 74 5.578.753 27416 (345) 92.24 45.687 979 119,355 45.687 970 (12.18 29.000 (279.600) (12.183) (29.000) Balance of September 27, 2014 Net Income Other comprehensive incoros) Dividends and dividend equivalent declared Repurchase of common stock Share-based compensation Common stack swed, net of shares with held for employee taxes Tax benefit from egy awards, including transfer pricing adjustments Balances as of September 26, 2015 Net income Other comprehensive income foss) Dividends and dividend equivalent declared Repurchase of common stock Share-based compensation Common stock issued, net of shares with held for employees Tax benefit from equity awards, including transfer pricing adustments Balances as of September 26, 2016 Net income Other comprehensive income) Dividends and dividend equivalents declared Repurchase of common stock Share-based compensation Common stock issued, net of shares withold for employees Tax become from equity awards, including transfer pricing austments Balances as of September 30, 2017 4.262 37.022 (805) (419 379 31.251 5,305,106 634 96,364 48.351 (784) 379 128 249 48 351 (784) (12,8001 (33.001) 4909 (246.496) (12,500) 133,001) 4.909 36,531 (913) (581) 01.494) 620 35.3675 5,126, 2015 98.330 620 134,047 $ (150) 3 See accompanying Notes to Consoldated Financial Statements Apple Inc. Apple Inc. CONSOLIDATED STATEMENTS OF CASH FLOWS (in Millions) September 30, 2017 20.484 Years ended September 24, 2016 21.120 September 26, 2015 13,844 5 $ 48.351 45.687 53,394 10,157 4,840 5,966 (166) 10.505 4210 4938 11.257 3,565 1.382 385 486 527 217 (51) Cash and cash equivalents, beginning of the year Operating activities: Net Income Adjustments to reconcile net income to cash generated by operating activities: Depreciation and amodization Share-based compensation expense Deferred income tax expense Other Changes in operating assets and liabilities: Accounts receivable, nel Inventories Vendor non-trade receivables Other current and non-current assets Accounts payable Deferred revenue Other current and non-current liabilities Cash generated by operating activities Investing activities Purchases of marketable securities Proceeds from maturities of marketable securines Proceeds from sales of marketable securities Payments made in connection with business acquisitions, net Payments for acquisition of property, plant and equipment Payments for adquisition of intangible asset Payments for strategic Investments.net Omer Cash used in investing activities Financing activities Proceeds from issuance of common stock Excess tax benefits from equity awards (2.000) (2.723) (4254) (5.318) 9.618 (626) (154) 63.500 1,055 1837 (1.554) (2,033) 65.824 417 (230) (3.735) (283) 5,000 1,042 9.05 31.265 (158,456) 31.775 94,564 (165,402) 14,530 107,447 (343) (11.247) (241) (329) (142.428) 21.25 90,530 (297) (12,734) (814) (1.383) (110) (45,977) (12.451) (344) (395) 220 (46.440) (26) (56,274) 555 627 495 407 543 249 527 217 151) 1.055 417 238 (3.735) (283) 5,001 1.042 0.058 81.265 1.837 (1554) (2003) 65.824 (402) 14,530 107447 3451 (11.2477 (241) 1329 Changes in operating assets and be Accounts receivable.net (2093) Inventore (2.7239 Vendor non-trade receivables Other current and non-currentes 15.018) Accounts payable 9,618 Deferred revenue 1626) Other current and noncurabite (154) Cash generated by operating activ 63.560 Investing activities Purchases of marketables (558) Proceeds from maturties of marketable securitie 31.775 Proceeds from sales of marble secure 26564 Payments made in connection with business acquisitions, net Payments for action of property, plant and equipment 112459) Payments for acquisition of intangible asset 1344) Payments for strategic investments, net (395) Other 220 Cast used in investing activities (40.465) Financing activities Prooveds from issuance of common stock 555 Excess tax benefits from equity awards Payments fortes related to net share soment of equity wards (1.674) Payment for dividends and vidend equivalent (12.700) Riepurchases of common stock (32.900) Proceeds from souance of tem debt, net 28.062 Repayments of term debt (2500) Change in commercial paper, net Cas used in financing activities (17347 Increase/Decrease in cash and cash equivos (195 Cash and cashev end of the year 20200 Supplement conflow disclosure Cashpad for income are not 3 11.30 Cash paid for interest 2.000 Se companying Notes to consolidated Financial Statements (142420) 21.254 90 536 297) 112.736) (814) (1.30) (1109 145.977 26 156.274) 495 407 11.570) 112.150) 20.722) 24,954 (2.500) 543 740 11.499) (11.561) 35.2530 27.114 (20.483 (630) 20.484 2.100 (17.710 7.276 21.120 $ S $ 10.444 1310 13.252 514 5 s Make a 5-year trend analysis, using 2013 as the base year, of (1) net sales and (2) net income. (To satisfy this requirement you must access information regarding performance in prior years. This information is provided in the complete annual report available on the company's website.) (Round percentages to O decimal places, eg, 15% and enter amounts in millions.) APPLE INC. Trend Analysis of Net Sales and Net Earnings For the Five Years Ended 2017 2017 2016 2015 $ 229234 215639 233715 (1) Net sales 134 126 Trend % 137 % $ (2) Net income 48351 45687 53394 Trend 131 % 123 % 144 Make a 5-year trend analysis, using 2013 as the base year, of (1) net sales and (2) net income. (To satisfy this requirement you must access information regarding performance in prior years. This information is provided in the complete annual report available on the company's website.) (Round percentages to O decimal places, eg. 15% and enter amounts in millions.) 2015 2014 2013 $ $ 170910 215639 233715 182795 107 100 126 137 X %6 % 39510 37037 45687 53394 107 100 % %6 123 144 %6 % % (51) Compute for 2017 and 2016 the (1) debt to assets ratio and (2) times interest earned. (Round percentages to decimal places, es 15% and times to 1 decimal place, eg. 152) 2017 2016 % % Debt to Assets Ratio times times Times Interest Earned
Step by Step Solution
There are 3 Steps involved in it

Get step-by-step solutions from verified subject matter experts