

Question: Need help with question B, Please help!! For this assignment, please use excel file group_assignment_1_portfolios.xls posted on blackboard under the folder of Excel Files. The
Need help with question B, Please help!!
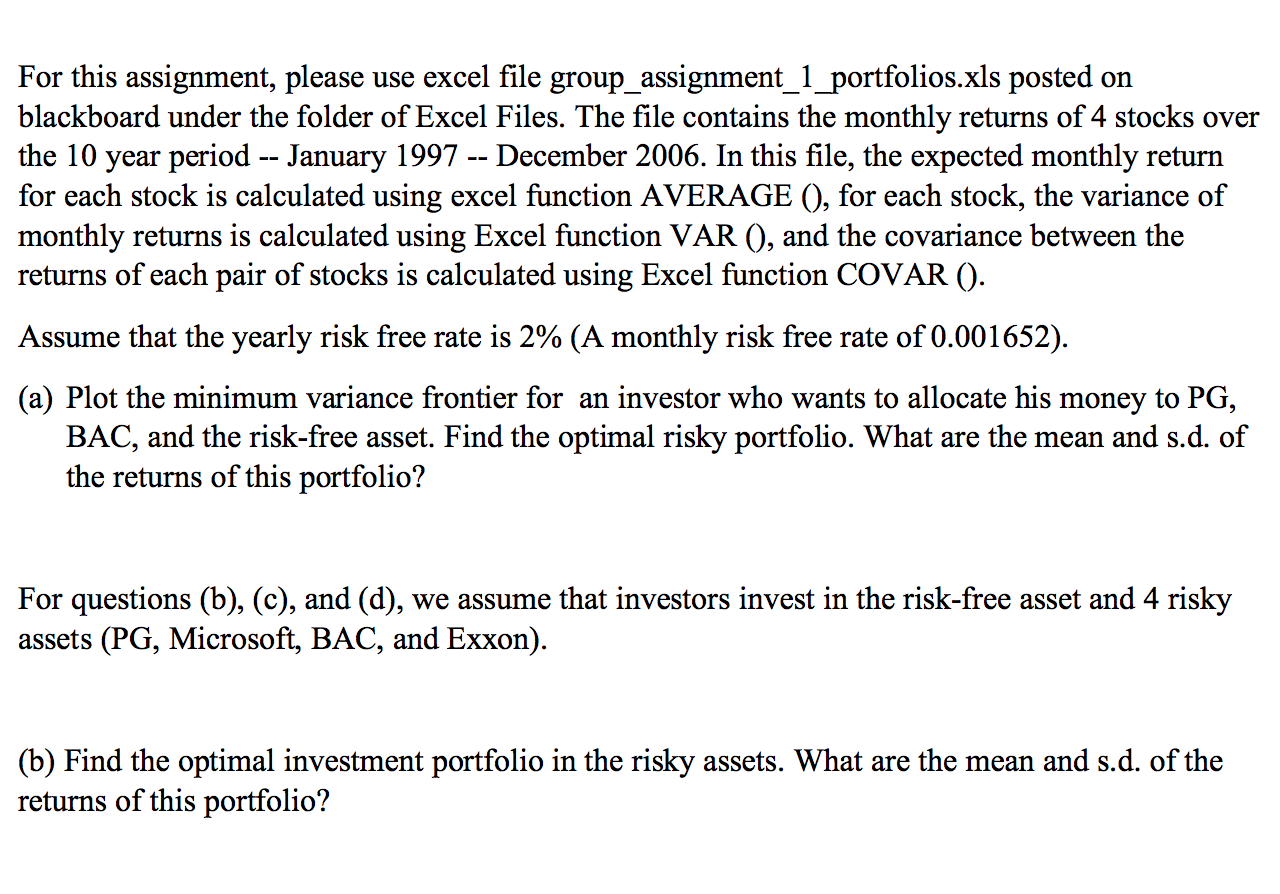
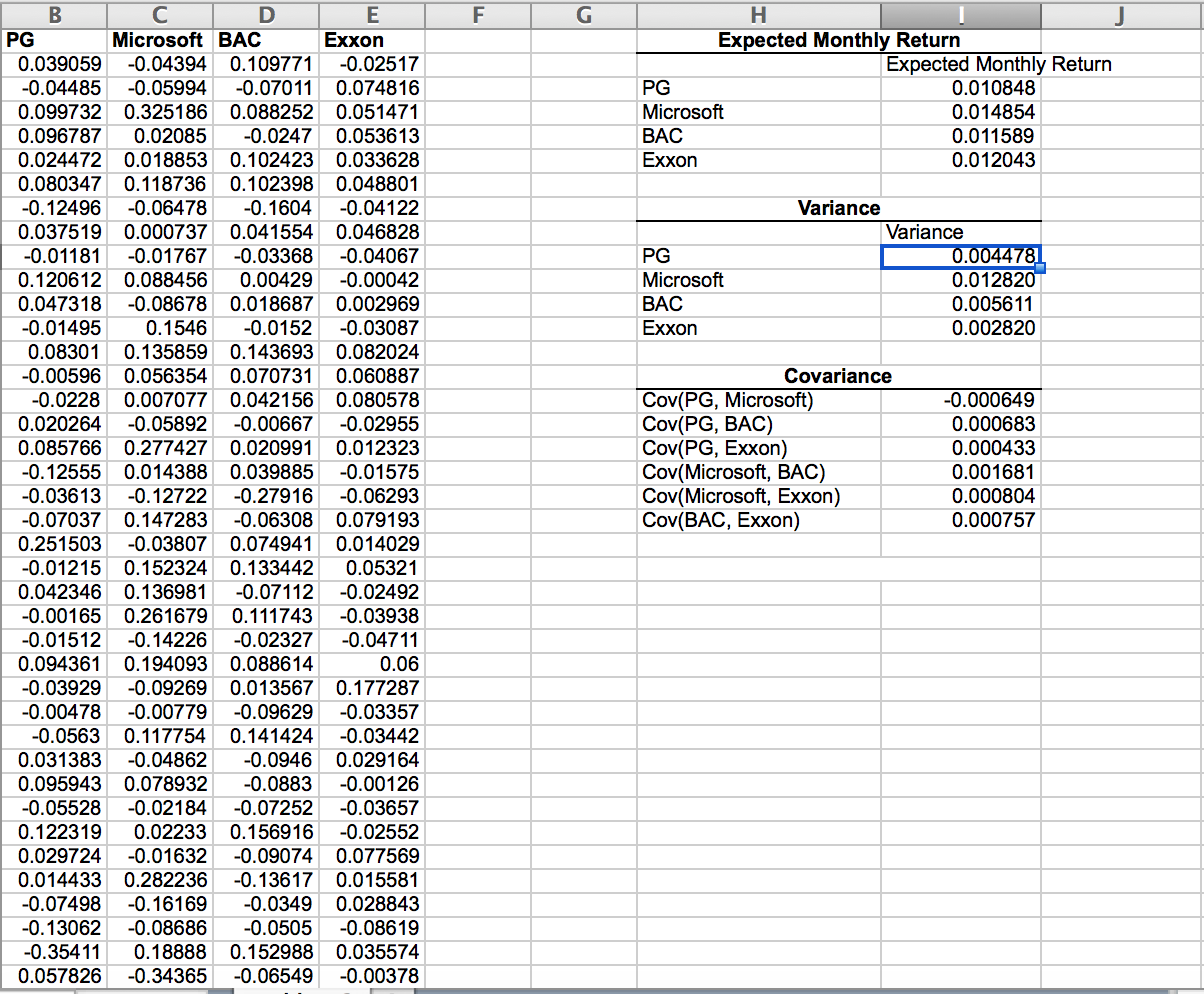
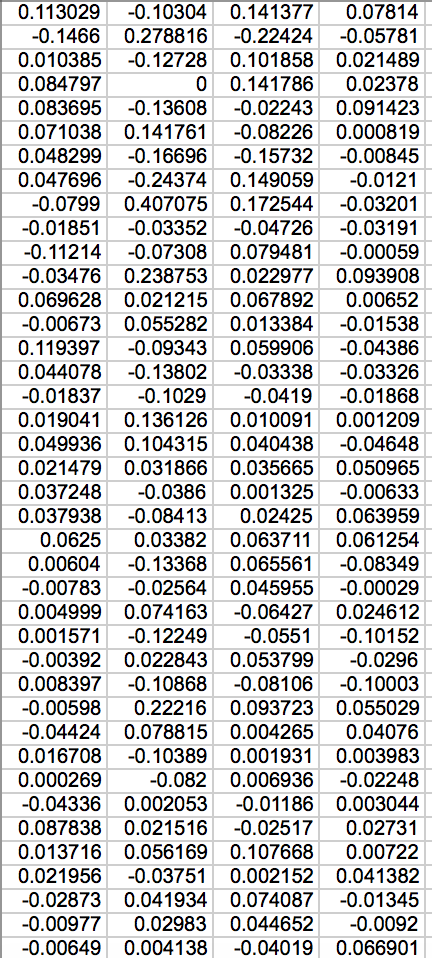
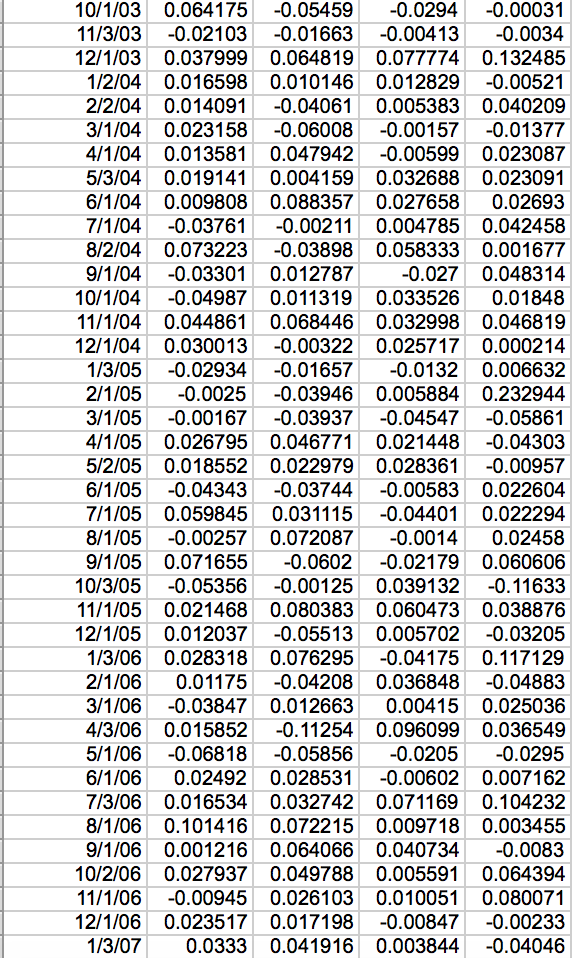
For this assignment, please use excel file group_assignment_1_portfolios.xls posted on blackboard under the folder of Excel Files. The file contains the monthly returns of 4 stocks over the 10 year period -- January 1997 -- December 2006. In this file, the expected monthly return for each stock is calculated using excel function AVERAGE (), for each stock, the variance of monthly returns is calculated using Excel function VAR (), and the covariance between the returns of each pair of stocks is calculated using Excel function COVAR (). Assume that the yearly risk free rate is 2% (A monthly risk free rate of 0.001652). (a) Plot the minimum variance frontier for an investor who wants to allocate his money to PG, BAC, and the risk-free asset. Find the optimal risky portfolio. What are the mean and s.d. of the returns of this portfolio? For questions (b), (c), and (d), we assume that investors invest in the risk-free asset and 4 risky assets (PG, Microsoft, BAC, and Exxon). (b) Find the optimal investment portfolio in the risky assets. What are the mean and s.d. of the returns of this portfolio? H Expected Monthly Return Expected Monthly Return PG 0.010848 Microsoft 0.014854 BAC 0.011589 Exxon 0.012043 PG Microsoft BAC Exxon Variance Variance 0.0044781 0.012820 0.005611 0.002820 C D E PG Microsoft BAC Exxon 0.039059 -0.04394 0.109771 -0.02517 -0.04485 -0.05994 -0.07011 0.074816 0.099732 0.325186 0.088252 0.051471 0.096787 0.02085 -0.0247 0.053613 0.024472 0.018853 0.102423 0.033628 0.080347 0.118736 0.102398 0.048801 -0.12496 -0.06478 -0.1604 -0.04122 0.037519 0.000737 0.041554 0.046828 -0.01181 -0.01767 -0.03368 -0.04067 0.120612 0.088456 0.00429 -0.00042 0.047318 -0.08678 0.018687 0.002969 -0.01495 0.1546 -0.0152 -0.03087 0.08301 0.135859 0.143693 0.082024 -0.00596 0.056354 0.070731 0.060887 -0.0228 0.007077 0.042156 0.080578 0.020264 -0.05892 -0.00667 -0.02955 0.085766 0.277427 0.020991 0.012323 -0.12555 0.014388 0.039885 -0.01575 -0.03613 -0.12722 -0.27916 -0.06293 -0.07037 0.147283 -0.06308 0.079193 0.251503 -0.03807 0.074941 0.014029 -0.01215 0.152324 0.133442 0.05321 0.042346 0.136981 -0.07112 -0.02492 -0.00165 0.261679 0.111743 -0.03938 -0.01512 -0.14226 -0.02327 -0.04711 0.094361 0.194093 0.088614 0.06 -0.03929 -0.09269 0.013567 0.177287 -0.00478 -0.00779 -0.09629 -0.03357 -0.0563 0.117754 0.141424 -0.03442 0.031383 -0.04862 -0.0946 0.029164 0.095943 0.078932 -0.0883 -0.00126 -0.05528 -0.02184 -0.07252 -0.03657 0.122319 0.02233 0.156916 -0.02552 0.029724 -0.01632 -0.09074 0.077569 0.014433 0.282236 -0.13617 0.015581 -0.07498 -0.16169 -0.0349 0.028843 -0.13062 -0.08686 -0.0505 -0.08619 -0.35411 0.18888 0.152988 0.035574 0.057826 -0.34365 -0.06549 -0.00378 Covariance Cov(PG, Microsoft) Cov(PG, BAC) Cov(PG, Exxon) Cov(Microsoft, BAC) Cov(Microsoft, Exxon) Cov(BAC, Exxon) -0.000649 0.000683 0.000433 0.001681 0.000804 0.000757 0.113029 -0.10304 0.141377 0.07814 || -0.1466 0.278816 -0.22424 -0.05781 0.010385 -0.12728 0.101858 0.021489 0.084797 0 0.141786 0.02378 | 0.083695 -0.13608 -0.02243 0.091423 | 0.071038 0.141761 -0.08226 0.000819 | 0.048299 -0.16696 -0.15732 -0.00845 0.047696 -0.24374 0.149059 -0.0121 -0.0799 0.407075 0.172544 -0.03201| -0.01851 -0.03352 -0.04726 -0.03191 -0.11214 -0.07308 0.079481 -0.00059 -0.03476 0.238753 0.022977 0.093908 0.069628 0.021215 0.067892 0.00652 -0.00673 0.055282 0.013384 -0.01538 0.119397 -0.09343 0.059906 | -0.04386 0.044078 -0.13802 -0.03338 | -0.03326 -0.01837 -0.1029 -0.0419 -0.01868 0.019041 0.136126 0.010091 0.001209 0.049936 0.104315 0.040438 -0.04648 0.021479 0.031866 0.035665 0.050965 0.037248 -0.0386 0.001325 -0.00633 0.037938 -0.08413 0.02425 0.063959 10.0625 0.03382 0.06371 0.061254 10.00604 -0.13368 0.065561 -0.08349 -0.00783 -0.02564 0.045955 -0.00029 0.004999 0.074163 -0.06427 0.024612 0.001571 -0.12249 -0.0551 -0.10152 -0.00392 0.022843 0.053799 -0.0296 10.008397 -0.10868 -0.08106 -0.10003 -0.00598 0.22216 0.093723 0.055029 -0.04424 0.078815 0.004265 0.04076 0.016708 -0.10389 0.001931 0.003983 | 0.000269 -0.082 0.006936 -0.02248 -0.04336 0.002053 -0.01186 0.003044 0.087838 0.021516 -0.02517 0.02731 | 0.013716 0.056169 0.107668 0.00722 0.021956 -0.03751 0.002152 0.041382 -0.02873 0.041934 0.074087 -0.01345 -0.00977 0.02983 0.044652 -0.0092 -0.00649 0.004138 -0.04019 0.066901|| 10/1/03 0.064175 -0.05459 -0.0294 -0.00031 11/3/03 -0.02103 -0.01663 -0.00413 -0.0034 12/1/03 0.037999 0.064819 0.077774 0.132485 1/2/04 0.016598 0.010146 0.012829 -0.00521 2/2/04 0.014091 -0.04061 0.005383 0.040209 13/1/04 0.023158 -0.06008 -0.00157 -0.01377 4/1/04 0.013581 0.047942 -0.00599 0.023087 15/3/04 0.019141 0.004159 0.032688 0.023091 6/1/04 0.009808 0.088357 0.027658 0.02693 17/1/04 -0.03761 -0.00211 0.004785 0.042458 8/2/04 0.073223 -0.03898 0.058333 0.001677 19/1/04 -0.03301 0.012787 -0.027 0.048314 10/1/04 -0.04987 0.011319 0.033526 0.01848 11/1/04 0.044861 0.068446 0.032998 0.046819 12/1/04 0.030013 -0.00322 0.025717 0.000214 13/05 -0.02934 -0.01657 -0.0132 0.006632 2/1/05 -0.0025 -0.03946 0.005884 0.232944 13/1/05 -0.00167 -0.03937 -0.04547 -0.05861 4/1/05 0.026795 0.046771 0.021448 -0.04303 15/2/05 0.018552 0.022979 0.028361 -0.00957 16/1/05 -0.04343 -0.03744 -0.00583 0.022604 17/1/05 0.059845 0.031115 -0.04401 0.022294 18/1/05 -0.00257 0.072087 -0.0014 0.02458 19/1/05 0.071655 -0.0602 -0.02179 0.060606 10/3/05 -0.05356 -0.00125 0.039132 -0.11633 11/1/05 0.021468 0.080383 0.060473 0.038876 12/1/05 0.012037 -0.05513 0.005702 -0.03205 1/13/06 0.028318 0.076295 -0.04175 0.117129 2/1/06 0.01175 -0.04208 0.036848 -0.04883 13/1/06 -0.03847 0.012663 0.00415 0.025036 4/3/06 0.015852 -0.11254 0.096099 0.036549 15/1/06 -0.06818 -0.05856 -0.0205 -0.0295 6/1/06 0.02492 0.028531 -0.00602 0.007162 7/3/06 0.016534 0.032742 0.071169 0.104232 8/1/06 0.101416 0.072215 0.009718 0.003455 19/1/06 0.001216 0.064066 0.040734 -0.0083 10/2/06 0.027937 0.049788 0.005591 0.064394 11/1/06 -0.00945 0.026103 0.010051 0.080071 12/1/06 0.023517 0.017198 -0.00847 -0.00233 1/3/07 0.0333 0.041916 0.003844 -0.04046 For this assignment, please use excel file group_assignment_1_portfolios.xls posted on blackboard under the folder of Excel Files. The file contains the monthly returns of 4 stocks over the 10 year period -- January 1997 -- December 2006. In this file, the expected monthly return for each stock is calculated using excel function AVERAGE (), for each stock, the variance of monthly returns is calculated using Excel function VAR (), and the covariance between the returns of each pair of stocks is calculated using Excel function COVAR (). Assume that the yearly risk free rate is 2% (A monthly risk free rate of 0.001652). (a) Plot the minimum variance frontier for an investor who wants to allocate his money to PG, BAC, and the risk-free asset. Find the optimal risky portfolio. What are the mean and s.d. of the returns of this portfolio? For questions (b), (c), and (d), we assume that investors invest in the risk-free asset and 4 risky assets (PG, Microsoft, BAC, and Exxon). (b) Find the optimal investment portfolio in the risky assets. What are the mean and s.d. of the returns of this portfolio? H Expected Monthly Return Expected Monthly Return PG 0.010848 Microsoft 0.014854 BAC 0.011589 Exxon 0.012043 PG Microsoft BAC Exxon Variance Variance 0.0044781 0.012820 0.005611 0.002820 C D E PG Microsoft BAC Exxon 0.039059 -0.04394 0.109771 -0.02517 -0.04485 -0.05994 -0.07011 0.074816 0.099732 0.325186 0.088252 0.051471 0.096787 0.02085 -0.0247 0.053613 0.024472 0.018853 0.102423 0.033628 0.080347 0.118736 0.102398 0.048801 -0.12496 -0.06478 -0.1604 -0.04122 0.037519 0.000737 0.041554 0.046828 -0.01181 -0.01767 -0.03368 -0.04067 0.120612 0.088456 0.00429 -0.00042 0.047318 -0.08678 0.018687 0.002969 -0.01495 0.1546 -0.0152 -0.03087 0.08301 0.135859 0.143693 0.082024 -0.00596 0.056354 0.070731 0.060887 -0.0228 0.007077 0.042156 0.080578 0.020264 -0.05892 -0.00667 -0.02955 0.085766 0.277427 0.020991 0.012323 -0.12555 0.014388 0.039885 -0.01575 -0.03613 -0.12722 -0.27916 -0.06293 -0.07037 0.147283 -0.06308 0.079193 0.251503 -0.03807 0.074941 0.014029 -0.01215 0.152324 0.133442 0.05321 0.042346 0.136981 -0.07112 -0.02492 -0.00165 0.261679 0.111743 -0.03938 -0.01512 -0.14226 -0.02327 -0.04711 0.094361 0.194093 0.088614 0.06 -0.03929 -0.09269 0.013567 0.177287 -0.00478 -0.00779 -0.09629 -0.03357 -0.0563 0.117754 0.141424 -0.03442 0.031383 -0.04862 -0.0946 0.029164 0.095943 0.078932 -0.0883 -0.00126 -0.05528 -0.02184 -0.07252 -0.03657 0.122319 0.02233 0.156916 -0.02552 0.029724 -0.01632 -0.09074 0.077569 0.014433 0.282236 -0.13617 0.015581 -0.07498 -0.16169 -0.0349 0.028843 -0.13062 -0.08686 -0.0505 -0.08619 -0.35411 0.18888 0.152988 0.035574 0.057826 -0.34365 -0.06549 -0.00378 Covariance Cov(PG, Microsoft) Cov(PG, BAC) Cov(PG, Exxon) Cov(Microsoft, BAC) Cov(Microsoft, Exxon) Cov(BAC, Exxon) -0.000649 0.000683 0.000433 0.001681 0.000804 0.000757 0.113029 -0.10304 0.141377 0.07814 || -0.1466 0.278816 -0.22424 -0.05781 0.010385 -0.12728 0.101858 0.021489 0.084797 0 0.141786 0.02378 | 0.083695 -0.13608 -0.02243 0.091423 | 0.071038 0.141761 -0.08226 0.000819 | 0.048299 -0.16696 -0.15732 -0.00845 0.047696 -0.24374 0.149059 -0.0121 -0.0799 0.407075 0.172544 -0.03201| -0.01851 -0.03352 -0.04726 -0.03191 -0.11214 -0.07308 0.079481 -0.00059 -0.03476 0.238753 0.022977 0.093908 0.069628 0.021215 0.067892 0.00652 -0.00673 0.055282 0.013384 -0.01538 0.119397 -0.09343 0.059906 | -0.04386 0.044078 -0.13802 -0.03338 | -0.03326 -0.01837 -0.1029 -0.0419 -0.01868 0.019041 0.136126 0.010091 0.001209 0.049936 0.104315 0.040438 -0.04648 0.021479 0.031866 0.035665 0.050965 0.037248 -0.0386 0.001325 -0.00633 0.037938 -0.08413 0.02425 0.063959 10.0625 0.03382 0.06371 0.061254 10.00604 -0.13368 0.065561 -0.08349 -0.00783 -0.02564 0.045955 -0.00029 0.004999 0.074163 -0.06427 0.024612 0.001571 -0.12249 -0.0551 -0.10152 -0.00392 0.022843 0.053799 -0.0296 10.008397 -0.10868 -0.08106 -0.10003 -0.00598 0.22216 0.093723 0.055029 -0.04424 0.078815 0.004265 0.04076 0.016708 -0.10389 0.001931 0.003983 | 0.000269 -0.082 0.006936 -0.02248 -0.04336 0.002053 -0.01186 0.003044 0.087838 0.021516 -0.02517 0.02731 | 0.013716 0.056169 0.107668 0.00722 0.021956 -0.03751 0.002152 0.041382 -0.02873 0.041934 0.074087 -0.01345 -0.00977 0.02983 0.044652 -0.0092 -0.00649 0.004138 -0.04019 0.066901|| 10/1/03 0.064175 -0.05459 -0.0294 -0.00031 11/3/03 -0.02103 -0.01663 -0.00413 -0.0034 12/1/03 0.037999 0.064819 0.077774 0.132485 1/2/04 0.016598 0.010146 0.012829 -0.00521 2/2/04 0.014091 -0.04061 0.005383 0.040209 13/1/04 0.023158 -0.06008 -0.00157 -0.01377 4/1/04 0.013581 0.047942 -0.00599 0.023087 15/3/04 0.019141 0.004159 0.032688 0.023091 6/1/04 0.009808 0.088357 0.027658 0.02693 17/1/04 -0.03761 -0.00211 0.004785 0.042458 8/2/04 0.073223 -0.03898 0.058333 0.001677 19/1/04 -0.03301 0.012787 -0.027 0.048314 10/1/04 -0.04987 0.011319 0.033526 0.01848 11/1/04 0.044861 0.068446 0.032998 0.046819 12/1/04 0.030013 -0.00322 0.025717 0.000214 13/05 -0.02934 -0.01657 -0.0132 0.006632 2/1/05 -0.0025 -0.03946 0.005884 0.232944 13/1/05 -0.00167 -0.03937 -0.04547 -0.05861 4/1/05 0.026795 0.046771 0.021448 -0.04303 15/2/05 0.018552 0.022979 0.028361 -0.00957 16/1/05 -0.04343 -0.03744 -0.00583 0.022604 17/1/05 0.059845 0.031115 -0.04401 0.022294 18/1/05 -0.00257 0.072087 -0.0014 0.02458 19/1/05 0.071655 -0.0602 -0.02179 0.060606 10/3/05 -0.05356 -0.00125 0.039132 -0.11633 11/1/05 0.021468 0.080383 0.060473 0.038876 12/1/05 0.012037 -0.05513 0.005702 -0.03205 1/13/06 0.028318 0.076295 -0.04175 0.117129 2/1/06 0.01175 -0.04208 0.036848 -0.04883 13/1/06 -0.03847 0.012663 0.00415 0.025036 4/3/06 0.015852 -0.11254 0.096099 0.036549 15/1/06 -0.06818 -0.05856 -0.0205 -0.0295 6/1/06 0.02492 0.028531 -0.00602 0.007162 7/3/06 0.016534 0.032742 0.071169 0.104232 8/1/06 0.101416 0.072215 0.009718 0.003455 19/1/06 0.001216 0.064066 0.040734 -0.0083 10/2/06 0.027937 0.049788 0.005591 0.064394 11/1/06 -0.00945 0.026103 0.010051 0.080071 12/1/06 0.023517 0.017198 -0.00847 -0.00233 1/3/07 0.0333 0.041916 0.003844 -0.04046
Step by Step Solution
There are 3 Steps involved in it

Get step-by-step solutions from verified subject matter experts