

Question: need help with the ratios portion, using cell references. A B Aspen Corporation Income Statement For year ending December 31 2020 2021 $ 1,245,071 $
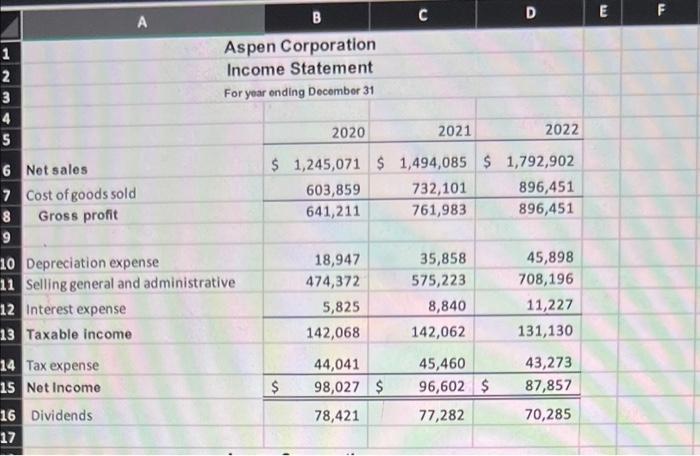
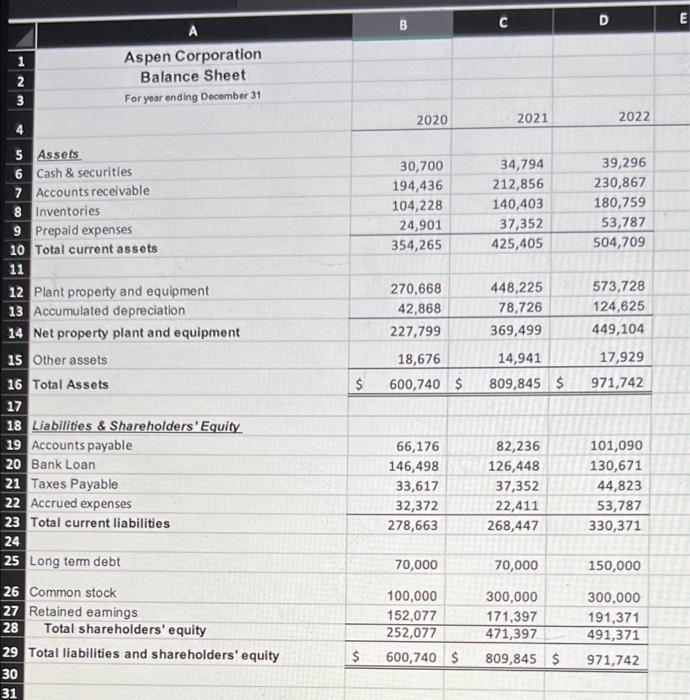
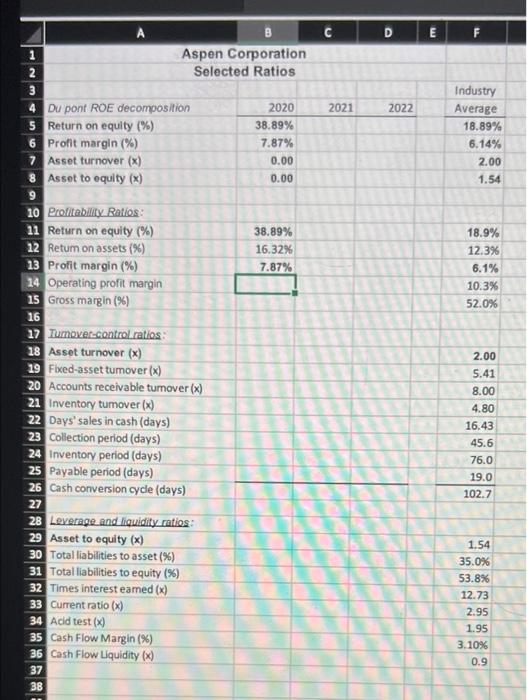
A B Aspen Corporation Income Statement For year ending December 31 2020 2021 $ 1,245,071 $ 1,494,085 $ 603,859 732,101 641,211 761,983. 18,947 35,858 474,372 575,223 5,825 8,840 142,068 142,062 44,041 45,460 98,027 $ 96,602 $ 78,421 77,282 1 2 3 4 5 6 Net sales 7 Cost of goods sold 8 Gross profit 9 10 Depreciation expense 11 Selling general and administrative 12 Interest expense 13 Taxable income 14 Tax expense 15 Net Income 16 Dividends 17 C $ D 2022 1,792,902 896,451 896,451 45,898 708,196 11,227 131,130 43,273 87,857 70,285 E F Aspen Corporation Balance Sheet For year ending December 31 1 2 3 5 Assets 6 Cash & securities 7 Accounts receivable 8 Inventories 9 Prepaid expenses 10 Total current assets 11 12 Plant property and equipment 13 Accumulated depreciation 14 Net property plant and equipment 15 Other assets 16 Total Assets 17 18 Liabilities & Shareholders' Equity 19 Accounts payable 20 Bank Loan 21 Taxes Payable 22 Accrued expenses 23 Total current liabilities 24 25 Long term debt 26 Common stock 27 Retained eamings 28 Total shareholders' equity 29 Total liabilities and shareholders' equity 30 31 B $ 2020 30,700 194,436 104,228 24,901 354,265 270,668 42,868 227,799 18,676 $ 600,740 $ 66,176 146,498 33,617 32,372 278,663 70,000 100,000 152,077 252,077 600,740 $ C 2021 34,794 212,856 140,403 37,352 425,405 448,225 78,726 369,499 14,941 809,845 $ 82,236 126,448 37,352 22,411 268,447 70,000 300,000 171,397 471,397 809,845 $ D 2022 39,296 230,867 180,759 53,787 504,709 573,728 124,625 449,104 17,929 971,742 101,090 130,671 44,823 53,787 330,371 150,000 300,000 191,371 491,371 971,742 E Aspen Corporation Selected Ratios 2020 38.89% 7.87% 0.00 0.00 38.89% 16.32% 7.87% 2 3 4 5 Return on equity (%) 6 Profit margin (%) 7 Asset turnover (x) 8 Asset to equity (x) 9 10 Profitability Ratios: 11 Return on equity (%) 12 Return on assets (%) 13 Profit margin (%) 14 Operating profit margin 15 Gross margin (%) 16 17 Turnover-control ratios: 18 Asset turnover (x) 19 Fixed-asset tumover (x) 20 Accounts receivable turnover (x) 21 Inventory tumover (x) 22 Days' sales in cash (days) 23 Collection period (days) 24 Inventory period (days) 25 Payable period (days) 26 Cash conversion cycle (days) 27 28 Leverage and liquidity ratios: 29 Asset to equity (x) 30 Total liabilities to asset (%) 31 Total liabilities to equity (%) 32 Times interest earned (x) 33 Current ratio (x) 34 Acid test (x) 35 Cash Flow Margin (%) 36 Cash Flow Liquidity (x) 37 38 Du pont ROE decomposition 2021 D 2022 E F Industry Average 18.89% 6.14% 2.00 1.54 18.9% 12.3% 6.1% 10.3% 52.0% 2.00 5.41 8.00 4.80 16.43 45.6 76.0 19.0 102.7 1.54 35.0% 53.8% 12.73 2.95 1.95 3.10% 0.9 A B Aspen Corporation Income Statement For year ending December 31 2020 2021 $ 1,245,071 $ 1,494,085 $ 603,859 732,101 641,211 761,983. 18,947 35,858 474,372 575,223 5,825 8,840 142,068 142,062 44,041 45,460 98,027 $ 96,602 $ 78,421 77,282 1 2 3 4 5 6 Net sales 7 Cost of goods sold 8 Gross profit 9 10 Depreciation expense 11 Selling general and administrative 12 Interest expense 13 Taxable income 14 Tax expense 15 Net Income 16 Dividends 17 C $ D 2022 1,792,902 896,451 896,451 45,898 708,196 11,227 131,130 43,273 87,857 70,285 E F Aspen Corporation Balance Sheet For year ending December 31 1 2 3 5 Assets 6 Cash & securities 7 Accounts receivable 8 Inventories 9 Prepaid expenses 10 Total current assets 11 12 Plant property and equipment 13 Accumulated depreciation 14 Net property plant and equipment 15 Other assets 16 Total Assets 17 18 Liabilities & Shareholders' Equity 19 Accounts payable 20 Bank Loan 21 Taxes Payable 22 Accrued expenses 23 Total current liabilities 24 25 Long term debt 26 Common stock 27 Retained eamings 28 Total shareholders' equity 29 Total liabilities and shareholders' equity 30 31 B $ 2020 30,700 194,436 104,228 24,901 354,265 270,668 42,868 227,799 18,676 $ 600,740 $ 66,176 146,498 33,617 32,372 278,663 70,000 100,000 152,077 252,077 600,740 $ C 2021 34,794 212,856 140,403 37,352 425,405 448,225 78,726 369,499 14,941 809,845 $ 82,236 126,448 37,352 22,411 268,447 70,000 300,000 171,397 471,397 809,845 $ D 2022 39,296 230,867 180,759 53,787 504,709 573,728 124,625 449,104 17,929 971,742 101,090 130,671 44,823 53,787 330,371 150,000 300,000 191,371 491,371 971,742 E Aspen Corporation Selected Ratios 2020 38.89% 7.87% 0.00 0.00 38.89% 16.32% 7.87% 2 3 4 5 Return on equity (%) 6 Profit margin (%) 7 Asset turnover (x) 8 Asset to equity (x) 9 10 Profitability Ratios: 11 Return on equity (%) 12 Return on assets (%) 13 Profit margin (%) 14 Operating profit margin 15 Gross margin (%) 16 17 Turnover-control ratios: 18 Asset turnover (x) 19 Fixed-asset tumover (x) 20 Accounts receivable turnover (x) 21 Inventory tumover (x) 22 Days' sales in cash (days) 23 Collection period (days) 24 Inventory period (days) 25 Payable period (days) 26 Cash conversion cycle (days) 27 28 Leverage and liquidity ratios: 29 Asset to equity (x) 30 Total liabilities to asset (%) 31 Total liabilities to equity (%) 32 Times interest earned (x) 33 Current ratio (x) 34 Acid test (x) 35 Cash Flow Margin (%) 36 Cash Flow Liquidity (x) 37 38 Du pont ROE decomposition 2021 D 2022 E F Industry Average 18.89% 6.14% 2.00 1.54 18.9% 12.3% 6.1% 10.3% 52.0% 2.00 5.41 8.00 4.80 16.43 45.6 76.0 19.0 102.7 1.54 35.0% 53.8% 12.73 2.95 1.95 3.10% 0.9
Step by Step Solution
There are 3 Steps involved in it

Get step-by-step solutions from verified subject matter experts