

Question: need help with this. Name(s): Date: B) Find the mean, median, mode, range, variance, and standard deviation of the Net Sales. Lab #3 Measures of
need help with this.
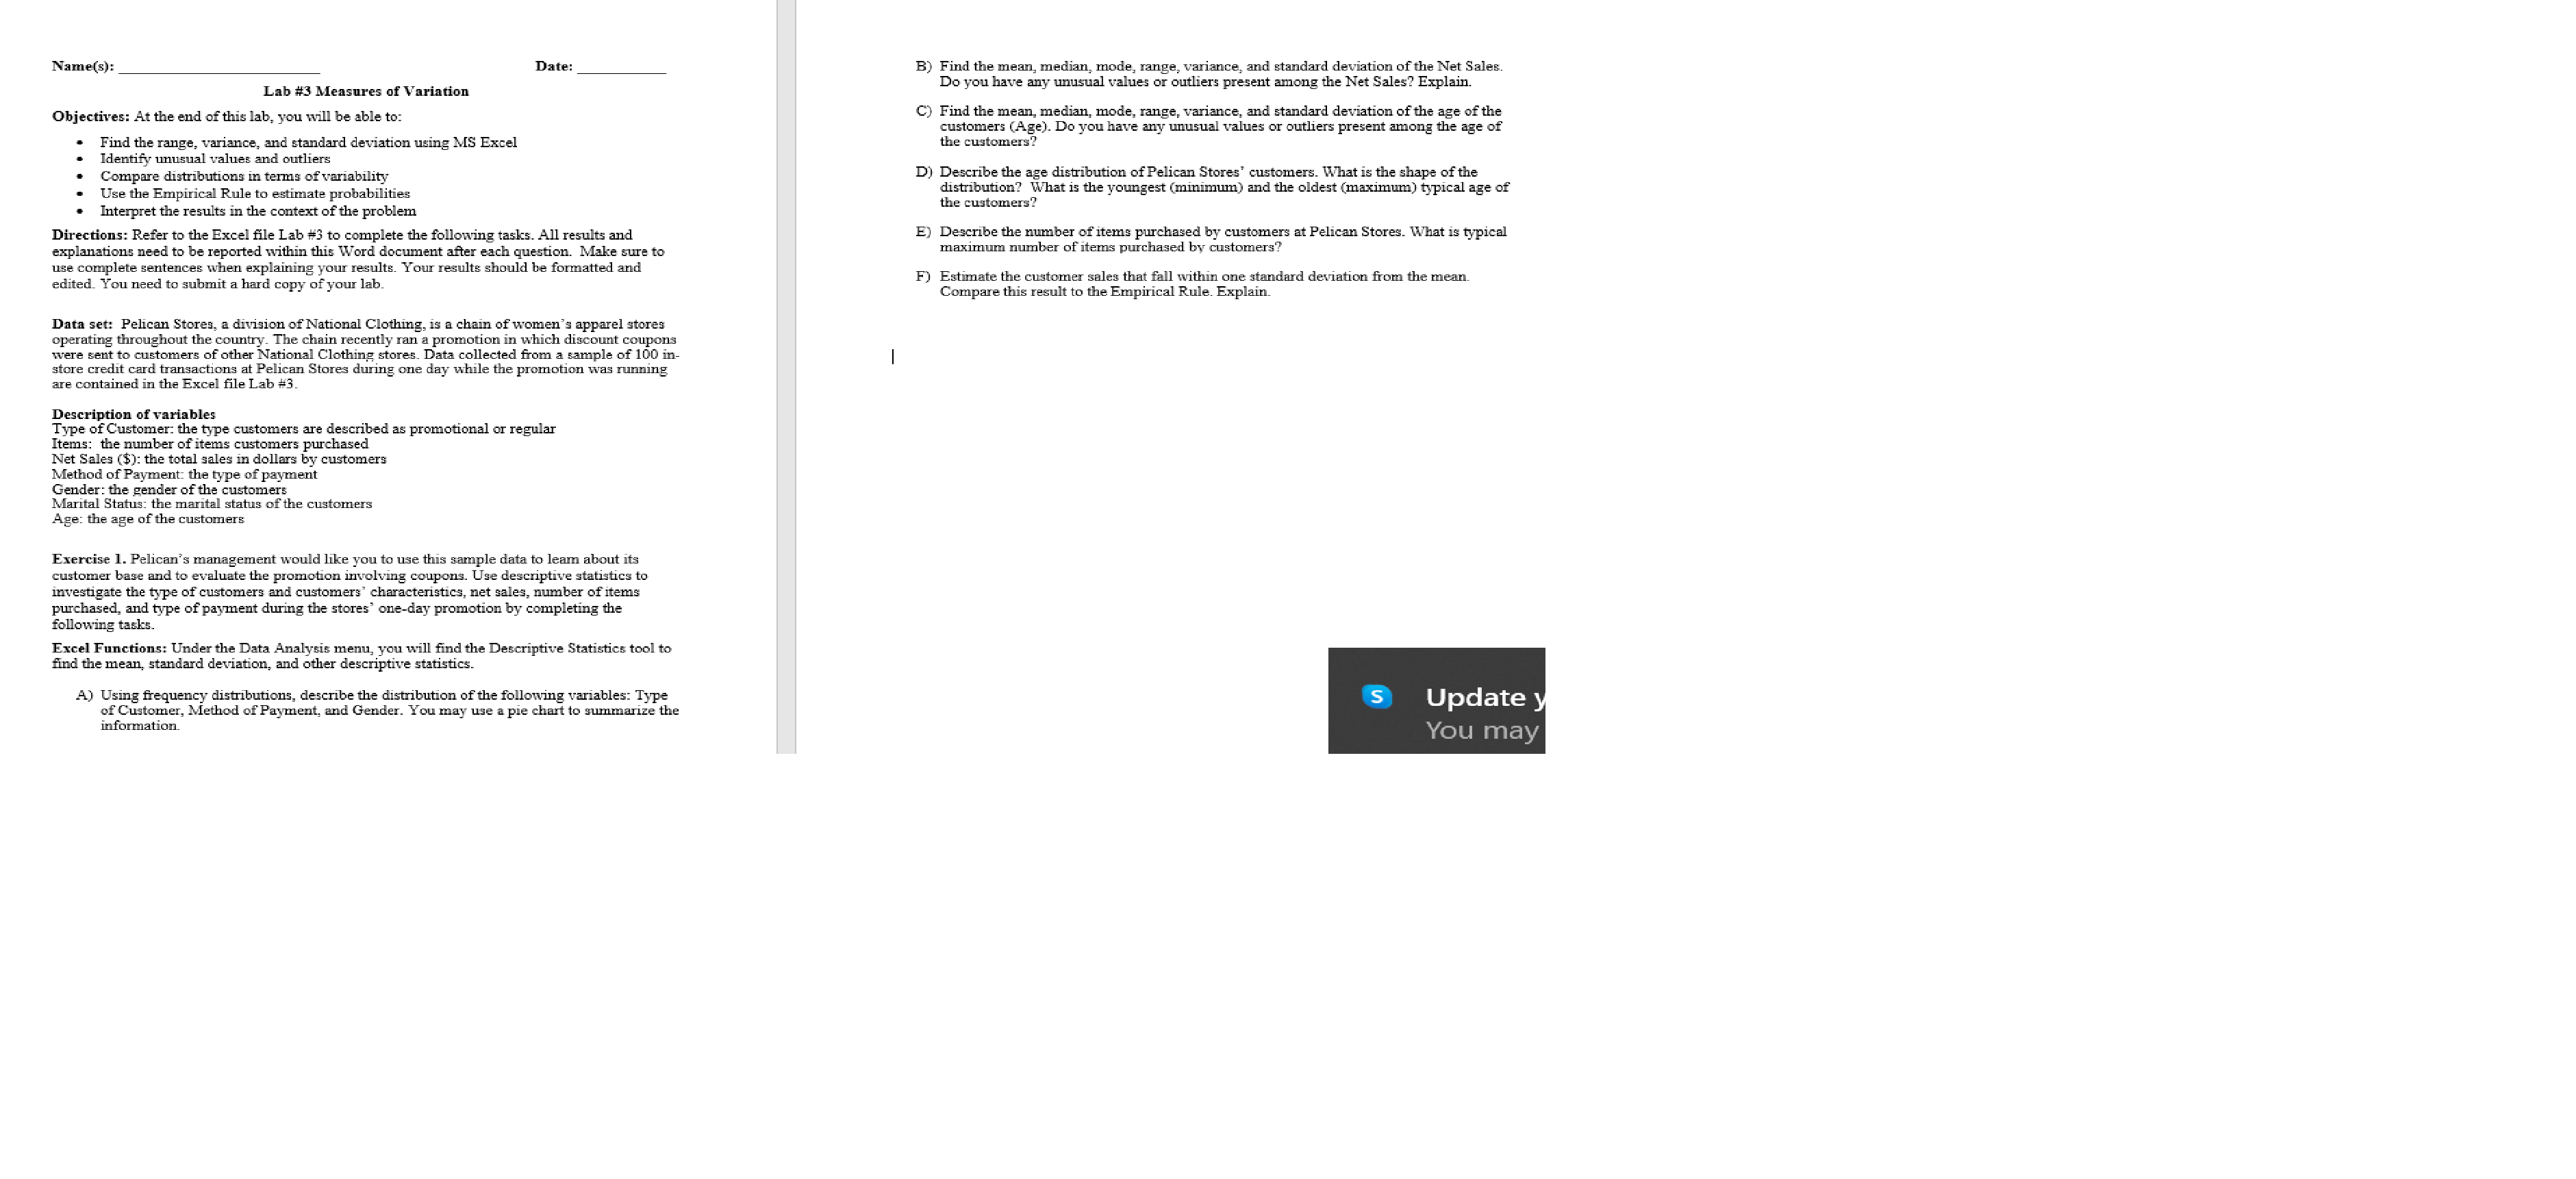
Name(s): Date: B) Find the mean, median, mode, range, variance, and standard deviation of the Net Sales. Lab #3 Measures of Variation Do you have any unusual values or outliers present among the Net Sales? Explain. Objectives: At the end of this lab, you will be able to: C) Find the mean, median, mode, range, variance, and standard deviation of the age of the customers (Age). Do you have any unusual values or outliers present among the age of Find the range, variance, and standard deviation using MS Excel the customers?" Identify unusual values and outliers Compare distributions in terms of variability D) Describe the age distribution of Pelican Stores' customers. What is the shape of the Use the Empirical Rule to estimate probabilities distribution? What is the youngest (minimum) and the oldest (maximum) typical age of Interpret the results in the context of the problem the customers? Directions: Refer to the Excel file Lab #3 to complete the following tasks. All results and E) Describe the number of items purchased by customers at Pelican Stores. What is typical explanations need to be reported within this Word document after each question. Make sure to maximum number of items purchased by customers? use complete sentences when explaining your results. Your results should be formatted and edited. You need to submit a hard copy of your lab. F) Estimate the customer sales tha I sales that fall within one standard deviation from the mean. Compare this result to the Empirical Rule. Explain. Data set: Pelican Stores, a division of National Clothing, is a chain of women's apparel stores operating throughout the country. The chain recently ran a promotion in which discount coupons were sent to customers of other National Clothing stores. Data collected from a sample of 100 in store credit card transactions at Pelican Stores during one day while the promotion was running are contained in the Excel file Lab #3. Description of variables Type of Customer: the type customers are described as promotional or regular Items: the number of items customers purchased Net Sales ($): the total sales in dollars by customers Method of Payment: the type of payment Gender: the gender of the customers Marital Status: the marital status of the customers Age: the age of the customers Exercise 1. Pelican's management would like you to use this sample data to leam about its customer base and to evaluate the promotion involving coupons. Use descriptive statistics to investigate the type of customers and customers' characteristics, net sales, number of items purchased, and type of payment during the stores' one-day promotion by completing the following tasks. Excel Functions: Under the Data Analysis menu, you will find the Descriptive Statistics tool to find the mean, standard deviation, and other descriptive statistics. A) Using frequency distributions, describe the distribution of the following variables: Type of Customer, Method of Payment, and Gender. You may use a pie chart to summarize the S Update y information. You may
Step by Step Solution
There are 3 Steps involved in it

Get step-by-step solutions from verified subject matter experts