

Question: Need help with this question. Thanks! For the data in problem 7, the target copper concentration ppm is 9.0. (a) Estimate the process standard deviation
Need help with this question. Thanks!
For the data in problem 7, the target copper concentration ppm is 9.0. (a) Estimate the process standard deviation from the control charts in problem 7. (b) Please make a tabular CUSUM chart for this process, using standardized values h = 5 and k = . (c) Interpret the CUSUM chart.
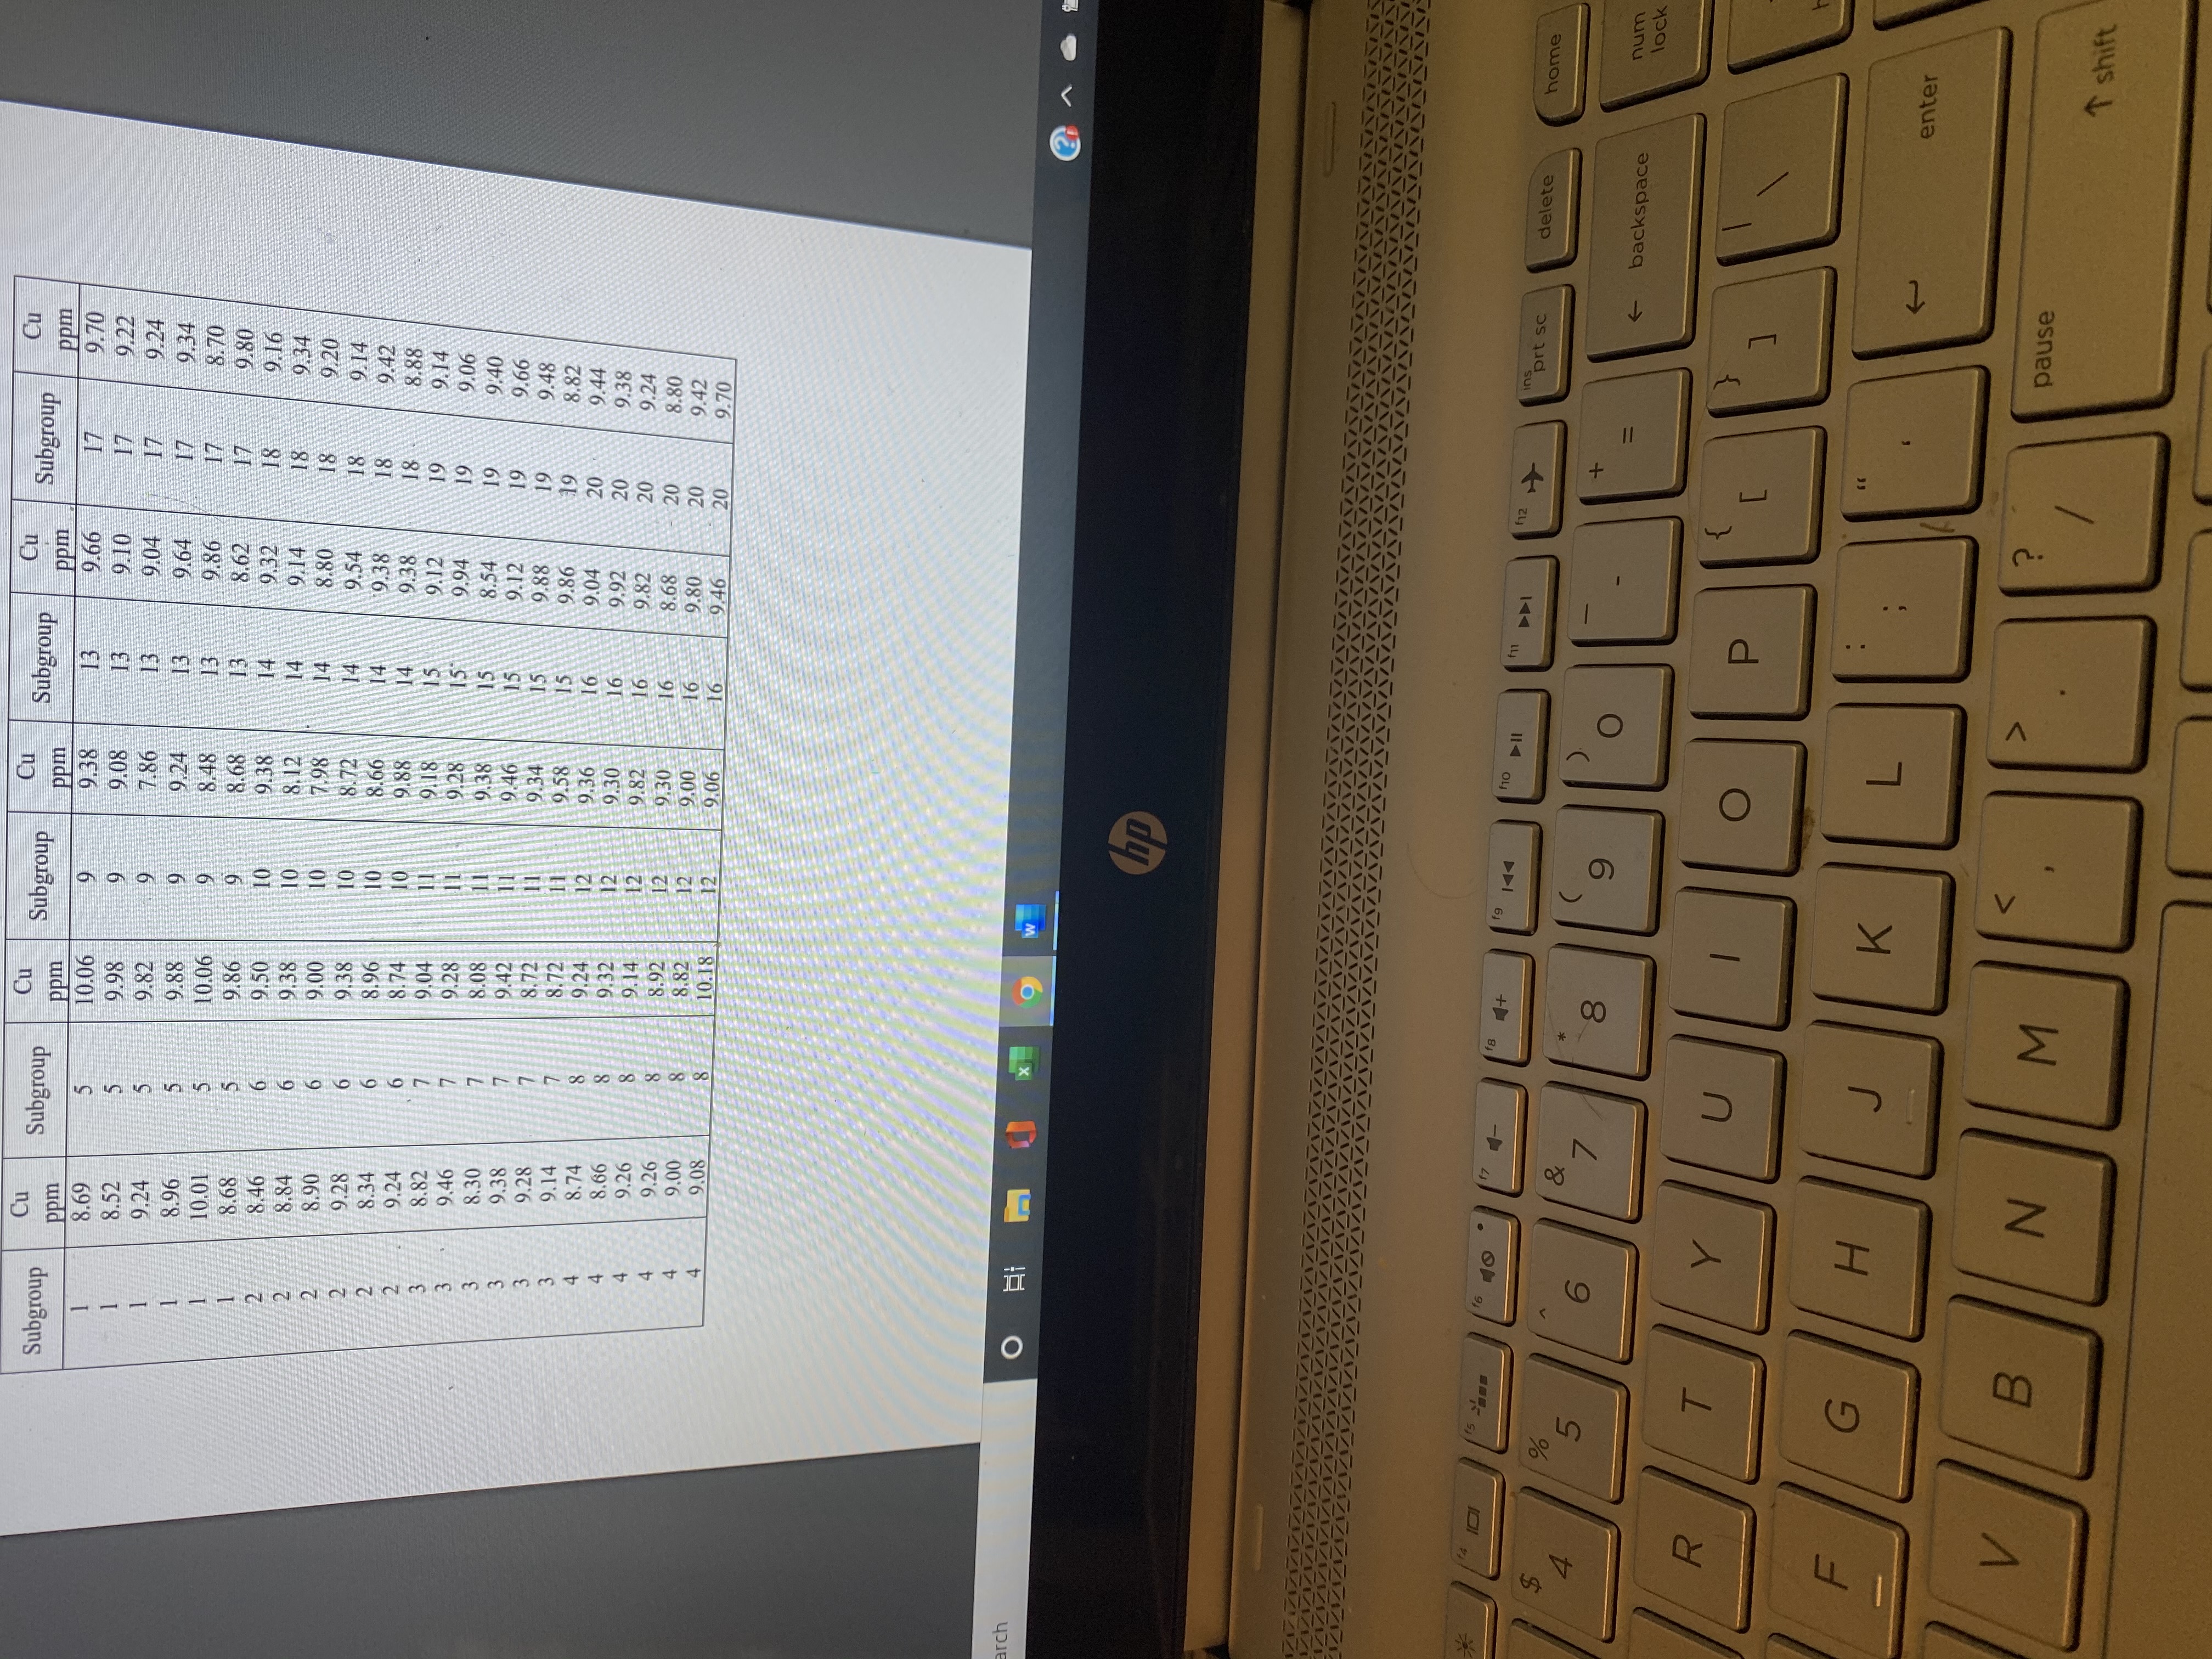
Cu Subgroup Cu Subgroup Cu Cu ppm Subgroup Cu Subgroup ppm ppm ppm Subgroup ppm 8.69 10.06 9.38 13 9.66 9.70 8.52 9.98 9.08 9.10 9.22 9.24 9.82 7.86 9.04 17 9.24 8.96 988 9.24 9.64 17 9.34 10.06 8.48 9.86 17 8.70 8.68 9.86 8.68 8.62 17 9 80 8.46 9.50 9.38 9.32 18 9.16 8.84 9.38 8.12 9.14 18 9.34 8.90 9.00 7.98 8.80 18 9.20 9.28 9.38 8.72 9.54 18 9.14 8.34 8.96 10 8.66 9.38 18 9.42 9.24 8.74 10 9.88 14 9.38 18 8.88 8.82 9.04 .18 9. 12 19 9.14 9.46 87 6 11 9 28 9.94 19 9.06 AAAAAAWWWWWWNNNNNN 8.30 8.08 9.38 15 8.54 19 9:40 9.38 9.42 11 9.46 15 9.12 19 9.66 9.28 8.72 11 9.34 15 9.88 19 9.48 9.14 8.72 11 9.58 15 8.74 9.24 9.86 19 8.82 12 9.36 16 9.04 20 9.44 8.66 9.32 9.30 16 9.26 9.14 12 9.92 20 9.38 9.82 16 9.82 20 9.26 9.24 6 9.00 8.92 12 12 9.30 8.68 20 8.80 16 9.08 8.82 9.00 9.80 20 9.42 9.06 9.46 20 9.70 arch O 19 W INAAN KIX 15 2105 16 0 DDI prt sc delete home 4 % 5 6 & 8 backspace num R T G H K enter B N M pause I shift
Step by Step Solution
There are 3 Steps involved in it

Get step-by-step solutions from verified subject matter experts