

Question: need help with work sheet. Consider historical data showing that the average annual rate of return on the S&P 500 portfolio over the past 85
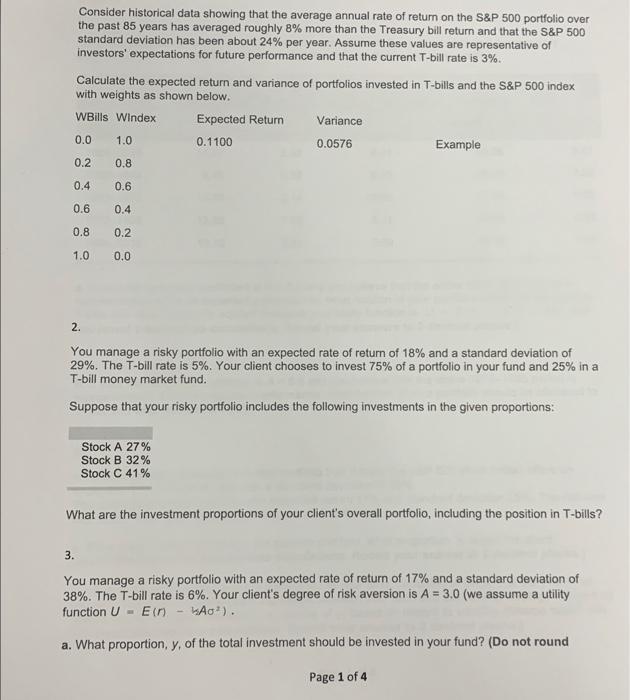
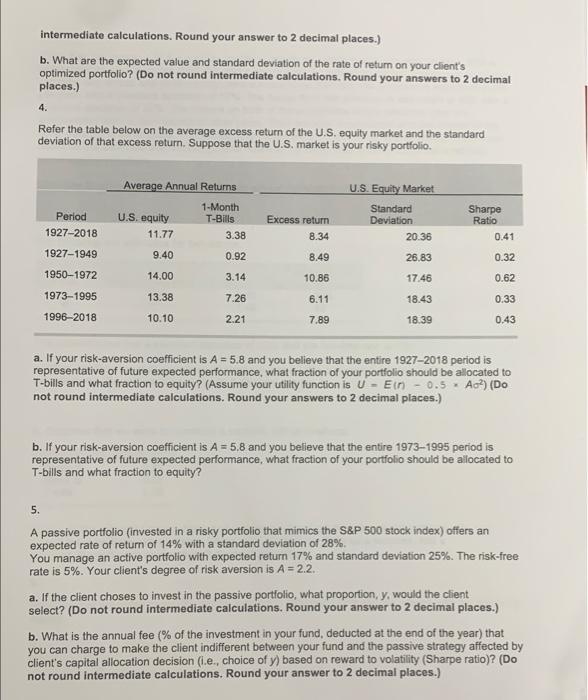
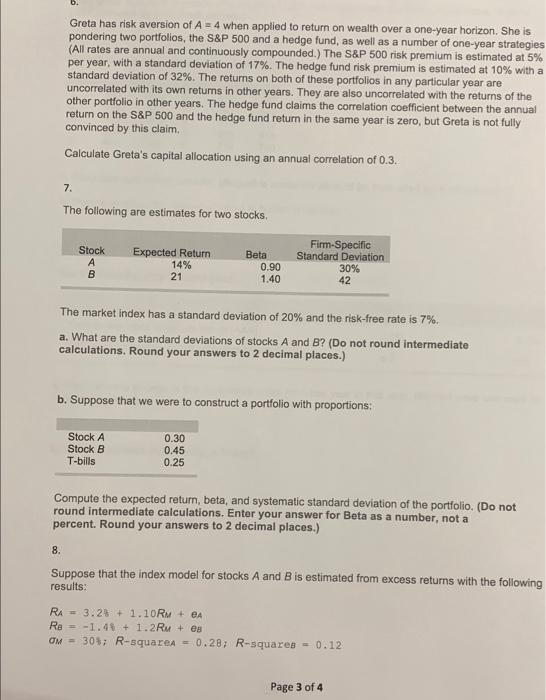
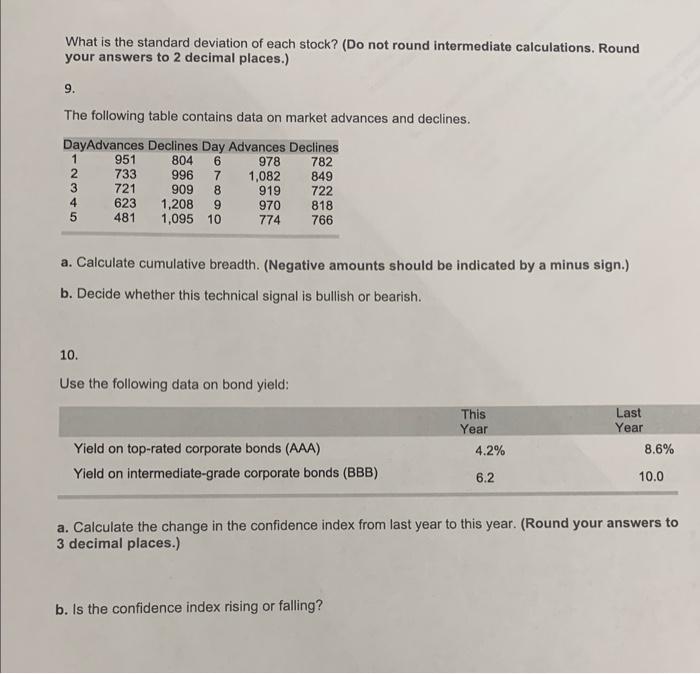
Consider historical data showing that the average annual rate of return on the S\&P 500 portfolio over the past 85 years has averaged roughly 8% more than the Treasury bill return and that the S\&P 500 standard deviation has been about 24% per year. Assume these values are representative of investors' expectations for future performance and that the current T-bill rate is 3%. Calculate the expected return and variance of portfolios invested in T-bills and the S\&P 500 index with weights as shown below. 2. You manage a risky portfolio with an expected rate of return of 18% and a standard deviation of 29%. The T-bill rate is 5%. Your client chooses to invest 75% of a portfolio in your fund and 25% in a T-bill money market fund. Suppose that your risky portfolio includes the following investments in the given proportions: What are the investment proportions of your client's overall portfolio, including the position in T-bills? 3. You manage a risky portfolio with an expected rate of return of 17% and a standard deviation of 38%. The T-bill rate is 6%. Your client's degree of risk aversion is A=3.0 (we assume a utility function U=E(n)kA2). intermediate calculations. Round your answer to 2 decimal places.) b. What are the expected value and standard deviation of the rate of return on your client's optimized portfolio? (Do not round intermediate calculations. Round your answers to 2 decimal places.) 4. Refer the table below on the average excess return of the U.S, equity market and the standard deviation of that excess return. Suppose that the U.S. market is your risky portfolio. a. If your risk-aversion coefficient is A=5.8 and you believe that the entire 19272018 period is representative of future expected performance, what fraction of your portfolio should be allocated to T-bills and what fraction to equity? (Assume your utility function is U=E(n)=0.5=Ao2) (Do not round intermediate calculations. Round your answers to 2 decimal places.) b. If your risk-aversion coefficient is A=5.8 and you believe that the entire 19731995 period is representative of future expected performance, what fraction of your portfolio should be allocated to T-bills and what fraction to equity? 5. A passive portfolio (invested in a risky portfolio that mimics the S\&P 500 stock index) offers an expected rate of return of 14% with a standard deviation of 28%. You manage an active portfolio with expected return 17% and standard deviation 25%. The risk-free rate is 5%. Your client's degree of risk aversion is A=2.2. a. If the client choses to invest in the passive portiolio, what proportion, y, would the client select? (Do not round intermediate calculations. Round your answer to 2 decimal places.) b. What is the annual fee ( % of the investment in your fund, deducted at the end of the year) that you can charge to make the client indifferent between your fund and the passive strategy affected by client's capital allocation decision (i.e., choice of y) based on reward to volatility (Sharpe ratio)? (Do not round intermediate calculations. Round your answer to 2 decimal places.) Greta has risk aversion of A=4 when applied to return on wealth over a one-year horizon. She is pondering two portfolios, the S\&P 500 and a hedge fund, as well as a number of one-year strategies (All rates are annual and continuously compounded.) The S\&P 500 risk premium is estimated at 5% per year, with a standard deviation of 17%. The hedge fund risk premium is estimated at 10% with a standard deviation of 32%. The returns on both of these portfolios in any particular year are uncorrelated with its own returns in other years. They are also uncorrelated with the returns of the other portfolio in other years. The hedge fund claims the correlation coefficient between the annual return on the S\&P 500 and the hedge fund return in the same year is zero, but Greta is not fully convinced by this claim. Calculate Greta's capital allocation using an annual correlation of 0.3 . 7. The following are estimates for two stocks. The market index has a standard deviation of 20% and the risk-free rate is 7%. a. What are the standard deviations of stocks A and B ? (Do not round intermediate calculations. Round your answers to 2 decimal places.) b. Suppose that we were to construct a portfolio with proportions: Compute the expected return, beta, and systematic standard deviation of the portfolio. (Do not round intermediate calculations. Enter your answer for Beta as a number, not a percent. Round your answers to 2 decimal places.) 8. Suppose that the index model for stocks A and B is estimated from excess returns with the following results: RA=3.27+1.10RM+eARB=1.48+1.2RM+eBM=30%;R-squareA=0.28;R-squares=0.12 What is the standard deviation of each stock? (Do not round intermediate calculations. Round your answers to 2 decimal places.) 9. The following table contains data on market advances and declines. a. Calculate cumulative breadth. (Negative amounts should be indicated by a minus sign.) b. Decide whether this technical signal is bullish or bearish. 10. Use the following data on bond yield: a. Calculate the change in the confidence index from last year to this year. (Round your answers to 3 decimal places.) b. Is the confidence index rising or falling
Step by Step Solution
There are 3 Steps involved in it

Get step-by-step solutions from verified subject matter experts