Question: need it solved asap please 1. (10 points) You will start your project by finding some data to model. (a) Decide what you are going

need it solved asap please
need it solved asap please 1. (10 points) You
1. (10 points) You will start your project by finding some data to model. (a) Decide what you are going to model. Below are some suggestions. Write your topic here. i. Look up the box office gross by week for your favorite movie. ii. Look up stats for a sport. Plot their team wins against some other stat (points, rebo interceptions, ERA, etc) iii. Look up the population or GDP of another country by year. iv. Look up COVID data for another state or country. v. Look up the stock price of a company you like by week. vi. Choose something else interesting to you. vii. If you have trouble locating or obtaining data, contact me and I will help you. (b) Give a link to the source of your data here. (c) Save the data into Excel. a 2. (15 points) You will now create a model using the data you found in question #1. (a) Using either Excel or Desmos, create a scatterplot of your data. (b) Examine your scatterplot. Decide on an appropriate model. List your choice of model here some reasons for your choice! (c) Use Excel or Desmos to find the equation of your chosen model. Report the equation here 3. (15 points) You will now use your model to make some predictions, (a) Use your model to make an interpolation. (b) Write a sentence interpreting your answer for part a in context (c) Use your model to make an extrapolation, (d) Write a sentence interpreting your answer for parte in context. 1. (10 points) You will start your project by finding some data to model. (a) Decide what you are going to model. Below are some suggestions. Write your topic here. i. Look up the box office gross by week for your favorite movie. ii. Look up stats for a sport. Plot their team wins against some other stat (points, rebo interceptions, ERA, etc) iii. Look up the population or GDP of another country by year. iv. Look up COVID data for another state or country. v. Look up the stock price of a company you like by week. vi. Choose something else interesting to you. vii. If you have trouble locating or obtaining data, contact me and I will help you. (b) Give a link to the source of your data here. (c) Save the data into Excel. a 2. (15 points) You will now create a model using the data you found in question #1. (a) Using either Excel or Desmos, create a scatterplot of your data. (b) Examine your scatterplot. Decide on an appropriate model. List your choice of model here some reasons for your choice! (c) Use Excel or Desmos to find the equation of your chosen model. Report the equation here 3. (15 points) You will now use your model to make some predictions, (a) Use your model to make an interpolation. (b) Write a sentence interpreting your answer for part a in context (c) Use your model to make an extrapolation, (d) Write a sentence interpreting your answer for parte in context

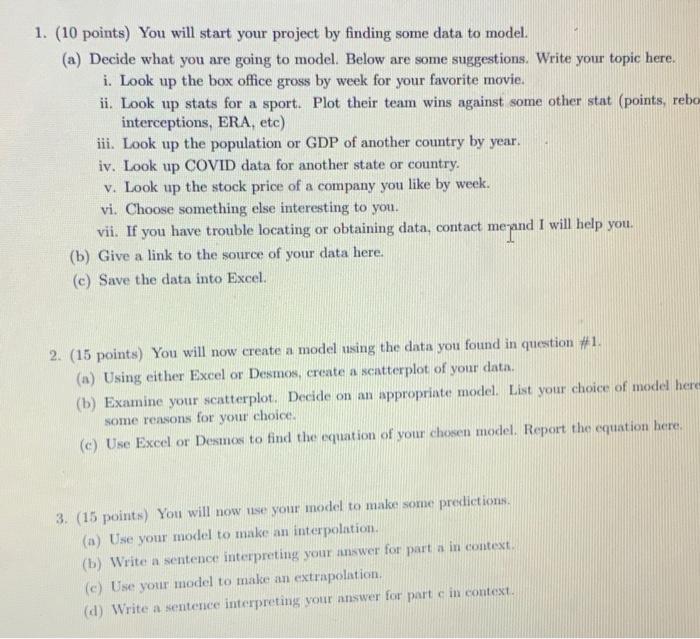
Step by Step Solution

There are 3 Steps involved in it

1 Expert Approved Answer
Step: 1 Unlock blur-text-image
Question Has Been Solved by an Expert!

Get step-by-step solutions from verified subject matter experts

Step: 2 Unlock
Step: 3 Unlock

Students Have Also Explored These Related General Management Questions!