

Question: NEED NUMBER 2! **the 'Actual' data for Question 3 is mislabeled. It should be data for the two seasons you created a forecast for in
NEED NUMBER 2!
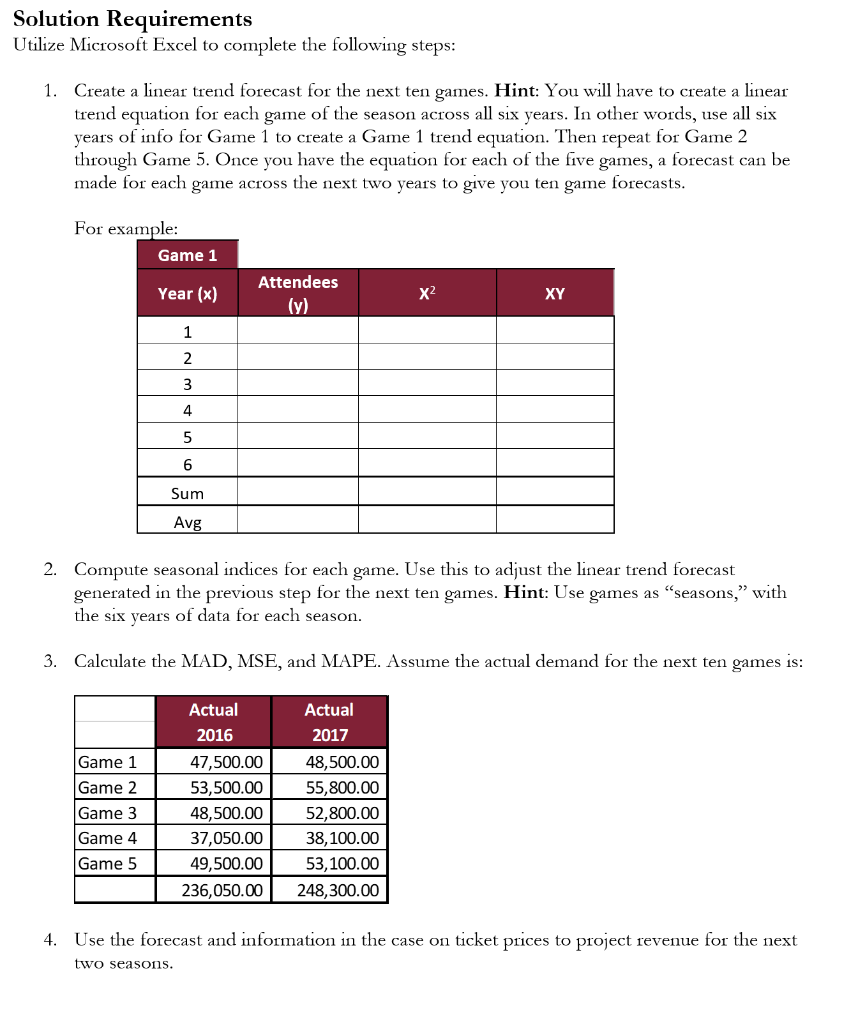
**the 'Actual' data for Question 3 is mislabeled. It should be data for the two seasons you created a forecast for in Question 2, which would be the 2022 and 2023 seasons**
Step by Step Solution
There are 3 Steps involved in it
1 Expert Approved Answer
Step: 1 Unlock

Question Has Been Solved by an Expert!
Get step-by-step solutions from verified subject matter experts
Step: 2 Unlock
Step: 3 Unlock