

Question: NEED STEP BY STEP INSTRUCTIONS ON HOW TO ANSWER THIS USING EXCEL, IF IT DOESNT HAVE STEP BY STEP I WILL PUT A THUMBSDOWN BECAUSE
NEED STEP BY STEP INSTRUCTIONS ON HOW TO ANSWER THIS USING EXCEL, IF IT DOESNT HAVE STEP BY STEP I WILL PUT A THUMBSDOWN BECAUSE YOU DIDNT FOLLOW DIRECTIONS.
Box Plots
Task Create a box plot that compares the total delay for arrival of old data and new
data for the end stations NYC and Schenectady The box plot should look like the
following example the chart below uses some random data so your chart will look
different Use Excel to create the chart and copy it here.
Explain what you understand from these charts.
Task Create a Box plot that compares the added times of departure for old and
new data by station. Your chart should be similar to the following chart. the chart below
uses some random data for only stations, so your chart will look different and includes
all stations Use Excel to create the chart and copy it here. Control charts
Task Create an IMR control charts that show before and after situations and
highlights the improvements in added time of departures. Use Excel to create the
charts. The beforeafter improvement control chart should look like the following example
the chart below uses some random data so your chart will look different; remember that
you need both Ichart and MRchart You need to combine the old and new data to
create these charts. Follow the instructions from the lectures to create these control
charts in Excel.
Explain what you understand from these charts. Is the process in control after
improvements?
Control charts
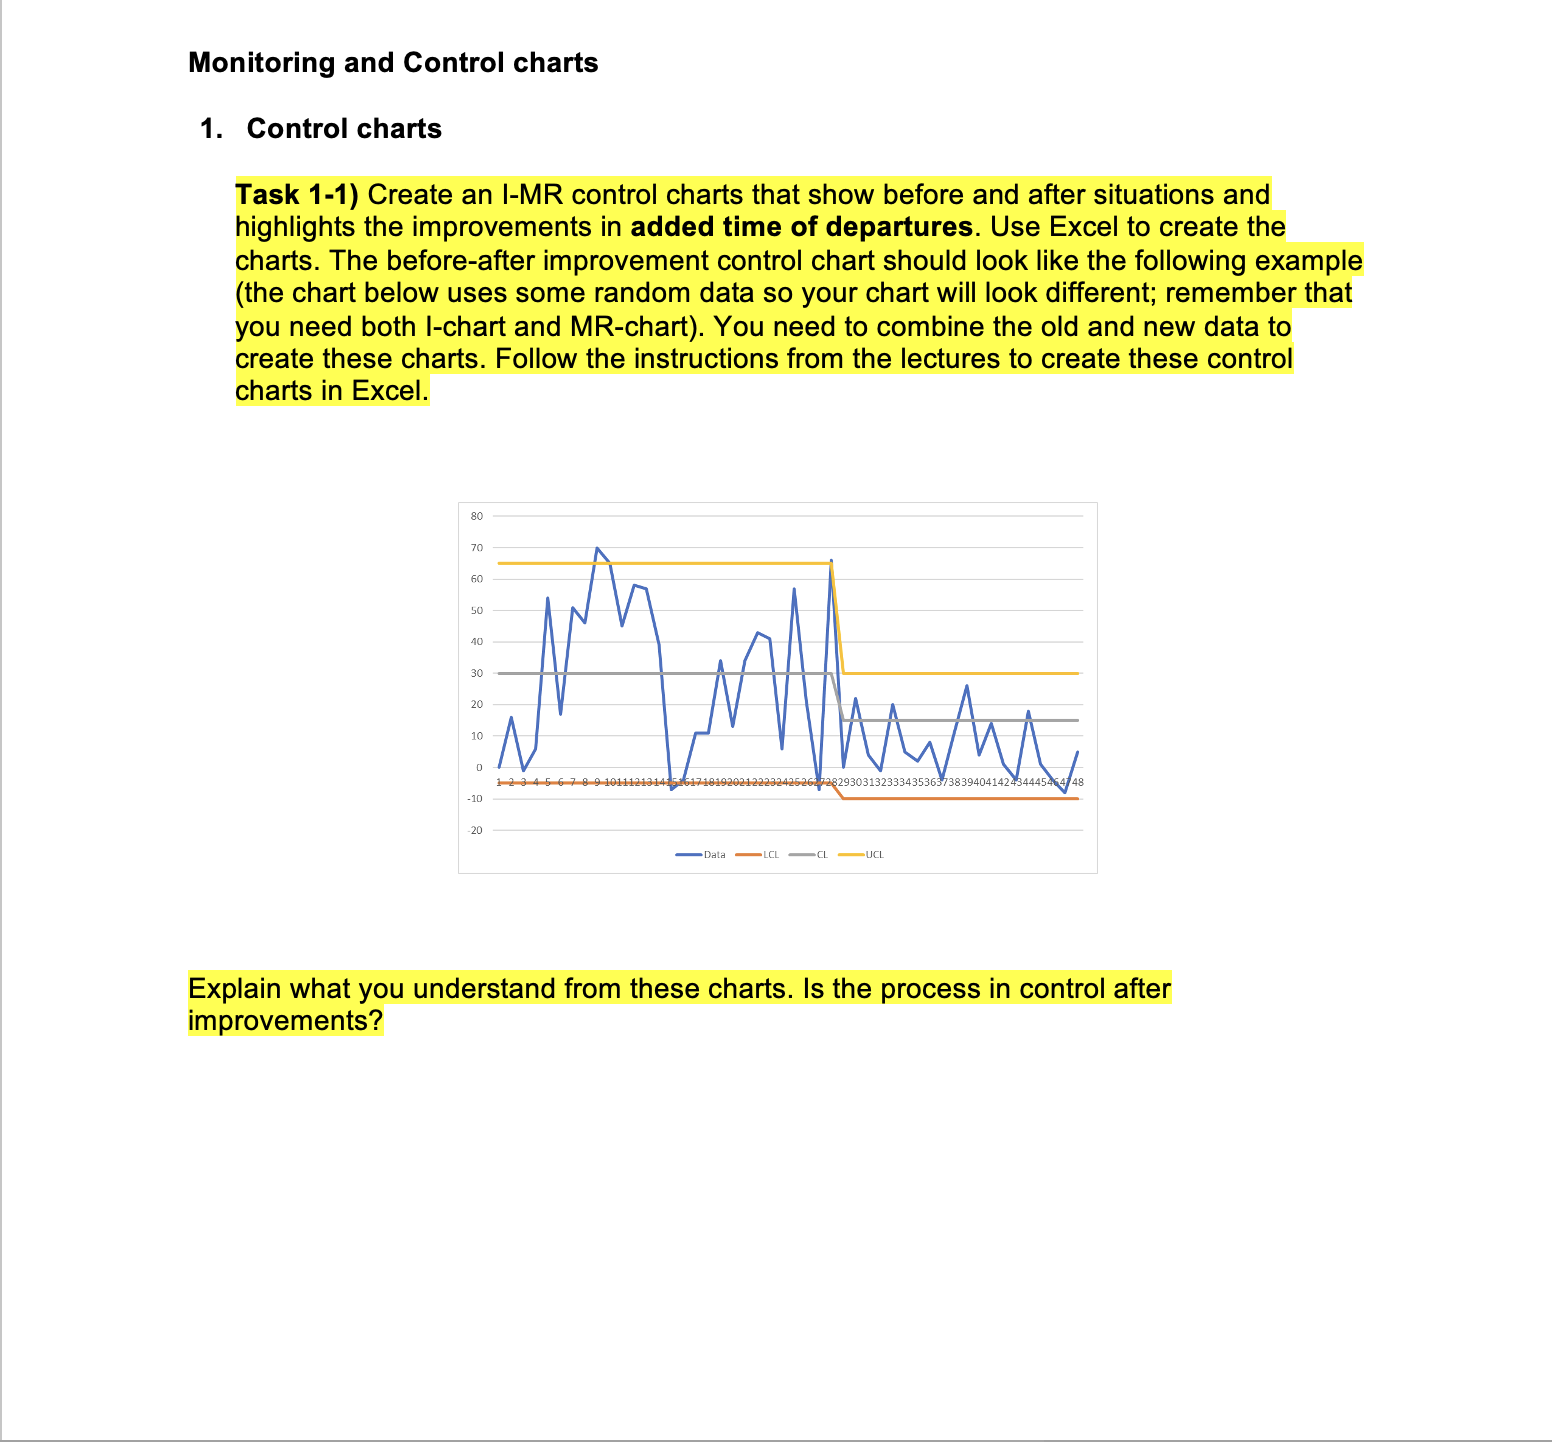
Task Create an IMR control charts that show before and after situations and
highlights the improvements in added time of departures. Use Excel to create the
charts. The beforeafter improvement control chart should look like the following example
the chart below uses some random data so your chart will look different; remember that
you need both Ichart and MRchart You need to combine the old and new data to
create these charts. Follow the instructions from the lectures to create these control
charts in Excel.
Explain what you understand from these charts. Is the process in control after
improvements?
Step by Step Solution
There are 3 Steps involved in it
1 Expert Approved Answer
Step: 1 Unlock

Question Has Been Solved by an Expert!
Get step-by-step solutions from verified subject matter experts
Step: 2 Unlock
Step: 3 Unlock