

Question: Need the answer for the question. Please help. zoom in please! The following data apply to Problems 8-12. A pension fund manager is considering three
Need the answer for the question. Please help.
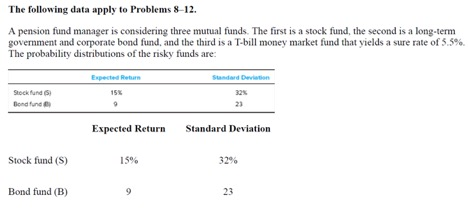
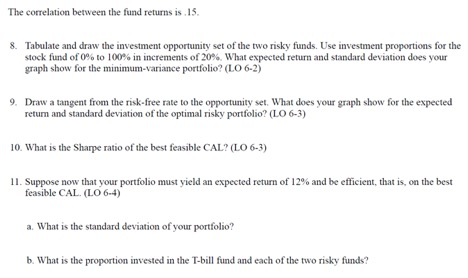
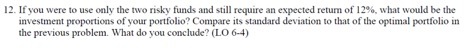
The following data apply to Problems 8-12. A pension fund manager is considering three mutual funds. The first is a stock fund, the second is a long-term government and corporate bond fund, and the third is a T-bill money market fund that yields a sure rate of 5.5%, The probability distributions of the risky funds are: Expected Retr Standard Deviaton 32% 23 Stock lund (S Expected Return Standard Deviation Stock fund (S) 1 5% 32% Bond fund (B) 23 The correlation between the fund returns is15 8. Tabulate and draw the investment opportunity set of the two risky funds. Use investment proportions for the stock fund of 0% to 100% in increments of 20% what expected return and standard deviation does your graph show for the minimum-variance portfolio? (LO 6-2) 9. Draw a tangent from the risk-free rate to the opportunity set. What does your graph show for the expected return and standard deviation of the optimal risky portfolio? (LO 6-3) 10. What is the Sharpe ratio of the best feasible CAL? (LO 6-3) 11 . Suppose now that your portfolio must yield an expected return of 12% and be efficient, that is, on the best feasible CAL (LO 6-4) a. What is the standard deviation of your portfolio? b. What is the proportion invested in the T-bill fund and each of the two risky funds? 12. If you were to use only the two risky funds and still require an expected return of 12%, what would be the investment proportions of your portfolio? Compare its standard deviation to that of the optimal portfolio in the previous problem. What do you conclude? (LO 6-4)
Step by Step Solution
There are 3 Steps involved in it

Get step-by-step solutions from verified subject matter experts