

Question: Need the matlab code for this Please upload a picture of the code in matlab, if its typed it will be confusing and unclearPart 3
Need the matlab code for this
Please upload a picture of the code in matlab, if its typed it will be confusing and unclearPart : Threshold the data & filter it
Sometimes, you will wish to say that any measured data below a certain value is "garbage". This value is called the "threshold". Conversely, you can say that any value above the threshold is meaningful.
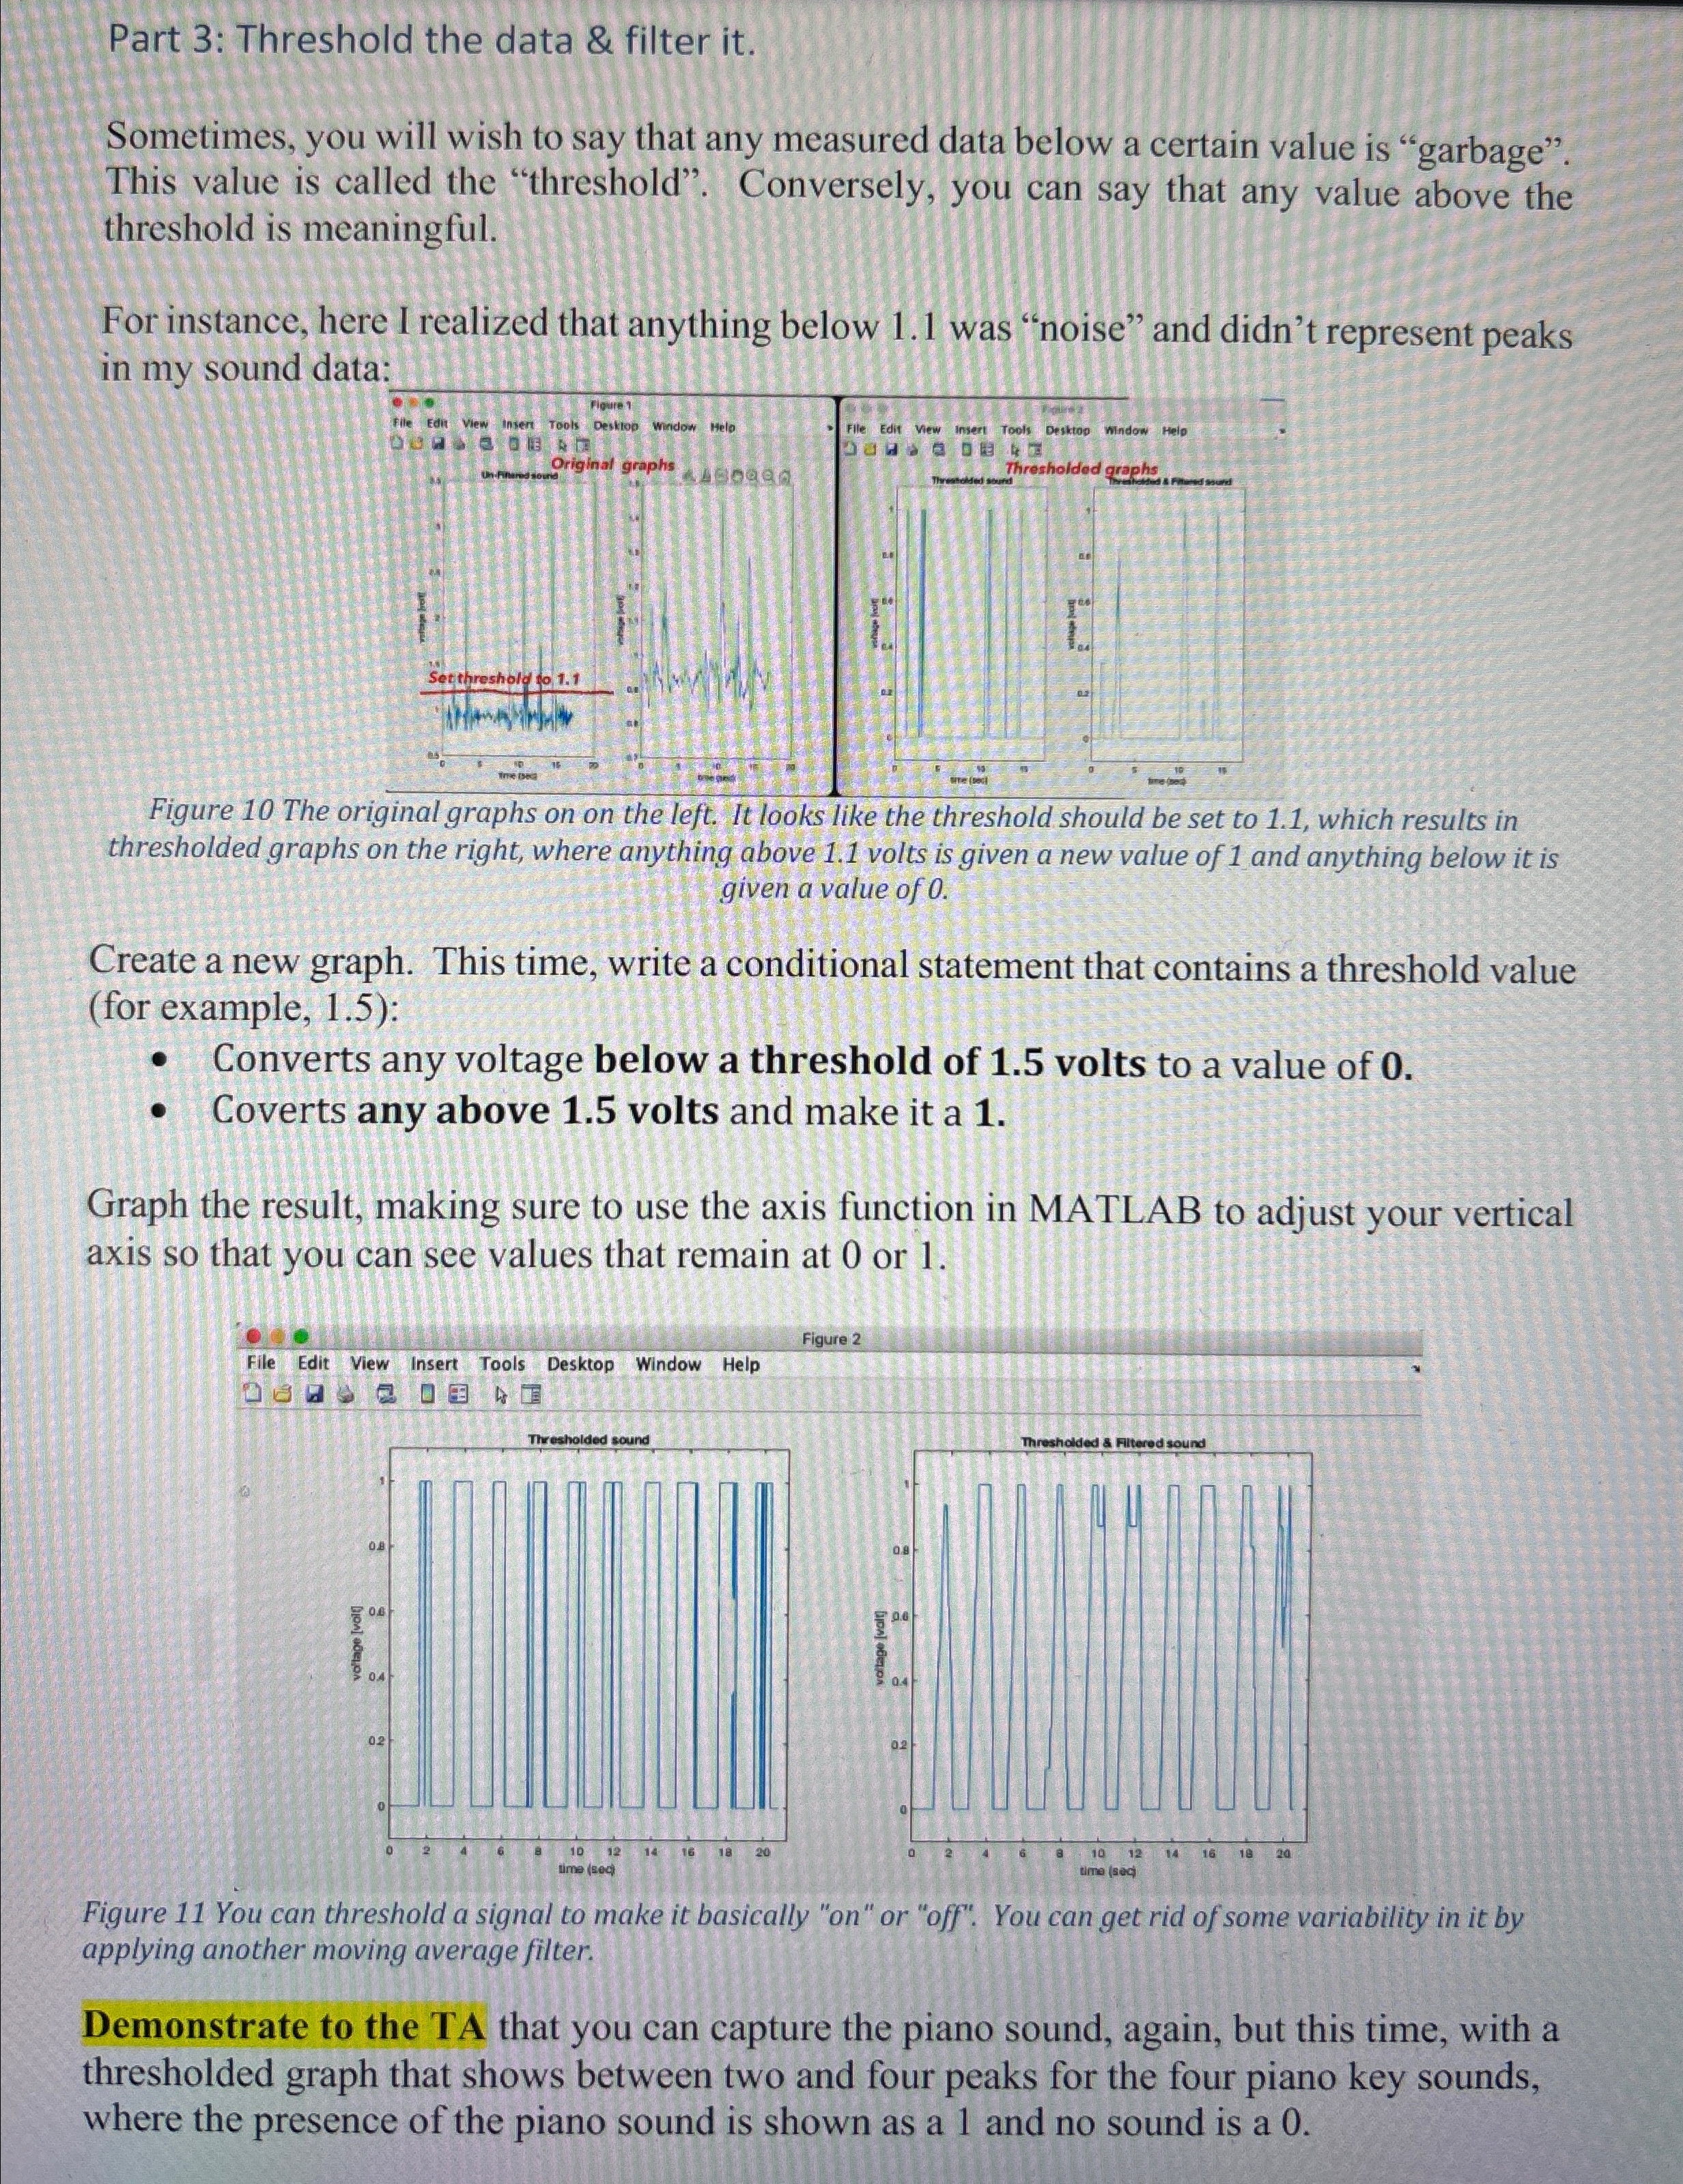
For instance, here I realized that anything below was "noise" and didn't represent peaks in my sound data:
Figure The original graphs on on the left. It looks like the threshold should be set to which results in thresholded graphs on the right, where anything above volts is given a new value of and anything below it is given a value of
Create a new graph. This time, write a conditional statement that contains a threshold value for example, :
Converts any voltage below a threshold of volts to a value of
Coverts any above volts and make it a
Graph the result, making sure to use the axis function in MATLAB to adjust your vertical axis so that you can see values that remain at or
Figure Yo it by applying another moving average filter.
Demonstrate to the TA that you can capture the piano sound, again, but this time, with a thresholded graph that shows between two and four peaks for the four piano key sounds, where the presence of the piano sound is shown as a and no sound is a
Step by Step Solution
There are 3 Steps involved in it
1 Expert Approved Answer
Step: 1 Unlock

Question Has Been Solved by an Expert!
Get step-by-step solutions from verified subject matter experts
Step: 2 Unlock
Step: 3 Unlock