

Question: Need to know how to do in Excel Construct X bar and R chart for the following cases. Week 6 - Control Chart for Variables
Need to know how to do in Excel
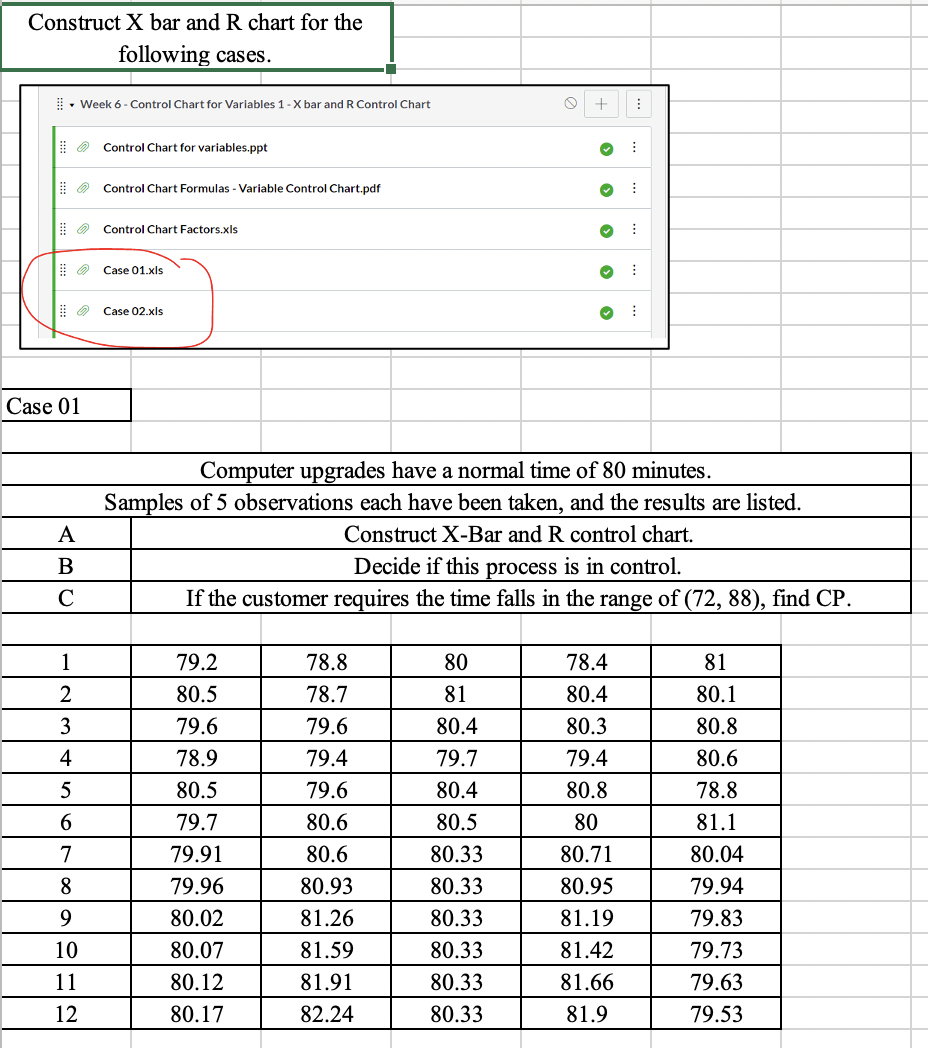
Construct X bar and R chart for the following cases. Week 6 - Control Chart for Variables 1 - X bar and R Control Chart Control Chart for variables.ppt : Control Chart Formulas - Variable Control Chart.pdf : Control Chart Factors.xls : Case 01.xls : Case 02.xls : Case 01 A Computer upgrades have a normal time of 80 minutes. Samples of 5 observations each have been taken, and the results are listed. Construct X-Bar and R control chart. Decide if this process is in control. If the customer requires the time falls in the range of (72, 88), find CP. B 1 2 3 4 78.8 78.7 79.6 79.4 79.6 80.6 80.6 78.4 80.4 80.3 79.4 80.8 79.2 80.5 79.6 78.9 80.5 79.7 79.91 79.96 80.02 80.07 80.12 80.17 5 6 80 81 80.4 79.7 80.4 80.5 80.33 80.33 80.33 80.33 80.33 80.33 81 80.1 80.8 80.6 78.8 81.1 80.04 79.94 79.83 79.73 79.63 79.53 7 8 9 10 11 12 80 80.71 80.95 81.19 81.42 81.66 81.9 80.93 81.26 81.59 81.91 82.24Step by Step Solution
There are 3 Steps involved in it
1 Expert Approved Answer
Step: 1 Unlock

Question Has Been Solved by an Expert!
Get step-by-step solutions from verified subject matter experts
Step: 2 Unlock
Step: 3 Unlock