

Question: need to know upper control limit and lower A company is looking to better understand the output of a process by developing appropriate SPC charts.
need to know upper control limit and lower 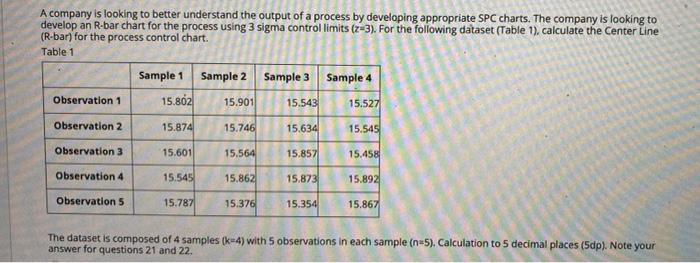
A company is looking to better understand the output of a process by developing appropriate SPC charts. The company is looking to develop an R-bar chart for the process using 3 sigma control limits (z-3). For the following dataset (Table 1). calculate the Center Line (R-bar) for the process control chart. Table 1 Sample 1 Sample 2 Sample 3 Sample 4 Observation 1 15.802 15.901 15.543 15.527 Observation 2 15.874 15.746 15.634 15.545 Observation 3 15.601 15.564 15.857 15.458 Observation 4 15.545 15.86% 15.873 15.892 Observation 5 15.787 15.376 15.354 15.867 The dataset is composed of 4 samples (4) with 5 observations in each sample (n=5). Calculation to 5 decimal places (5dp). Note your answer for questions 21 and 22 Step by Step Solution
There are 3 Steps involved in it
1 Expert Approved Answer
Step: 1 Unlock

Question Has Been Solved by an Expert!
Get step-by-step solutions from verified subject matter experts
Step: 2 Unlock
Step: 3 Unlock