

Question: Net Profit Margin Operating Margin Return on Assets Return on Equity Revenue Total Cash Total Debt Current Ratio Price per share Earnings per share Dollar
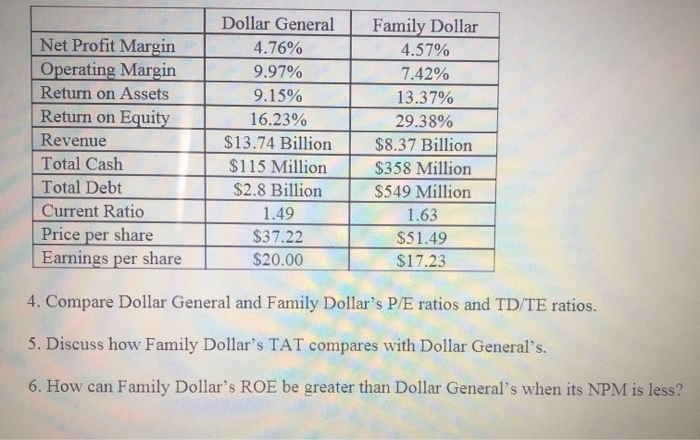
Net Profit Margin Operating Margin Return on Assets Return on Equity Revenue Total Cash Total Debt Current Ratio Price per share Earnings per share Dollar General 4.76% 9.97% 9.15% 16.23% $13.74 Billion $115 Million $2.8 Billion 1.49 $37.22 $20.00 Family Dollar 4.57% 7.42% 13.37% 29.38% $8.37 Billion $358 Million $549 Million 1.63 $51.49 $17.23 4. Compare Dollar General and Family Dollar's P/E ratios and TD/TE ratios. 5. Discuss how Family Dollar's TAT compares with Dollar General's. 6. How can Family Dollar's ROE be greater than Dollar General's when its NPM is less
Step by Step Solution
There are 3 Steps involved in it
1 Expert Approved Answer
Step: 1 Unlock

Question Has Been Solved by an Expert!
Get step-by-step solutions from verified subject matter experts
Step: 2 Unlock
Step: 3 Unlock