

Question: Based on the information in the case, use the Operations Analytics Case Study Data file, the Operations Analytics Case Study Template, and the Excel drawing
Based on the information in the case, use the "Operations Analytics Case Study Data" file, the "Operations Analytics Case Study Template," and the Excel drawing tools to create a task network diagram based on the "Production Steps" information in the case. To clarify this information, assume the following:
- The "Cover marketing created" task is a successor to the "First edit" task.
- The "Printer selection" task is a successor to the "Interior Layout (Pagination)" task.
- The "Project sent to printer" task is a successor to the "Printer selection" task.
Place your task network diagram in the "NetworkDiagram" sheet of the "Operations Analytics Case Study Template."
Using the "Operations Analytics Case Study Template" file as a starting point, create Excel formulas for the following cells for each task:
- Activity time (days)
- Start (days)
- Finish (days)
- Resource availability (days)
- Expected to be behind?
- Cost of backup contractor
- Actual backup cost
For Tasks 3, 4, 6, and 8-10 in the spreadsheet assume that the "Activity Times (Days)" will be the stated Mean times.
For Tasks 1, 2, 5, 7, and 11-14 in the spreadsheet, assume that each of these "Activity Times" can vary by 50% of their mean values and that they each follow a Uniform Distribution (i.e., each value has an equal chance of occurring).
Using Microsoft Excel's "Spin Button" in the "Developer" tab, create spin buttons to vary the Activity Times accordingly for each of these tasks.
Ensure that your model includes calculations for "Process Completion Time" and "Total Actual Backup Cost." Your model should approximate what factors could cause the "Total Actual Backup Cost" to exceed $3,000.00.
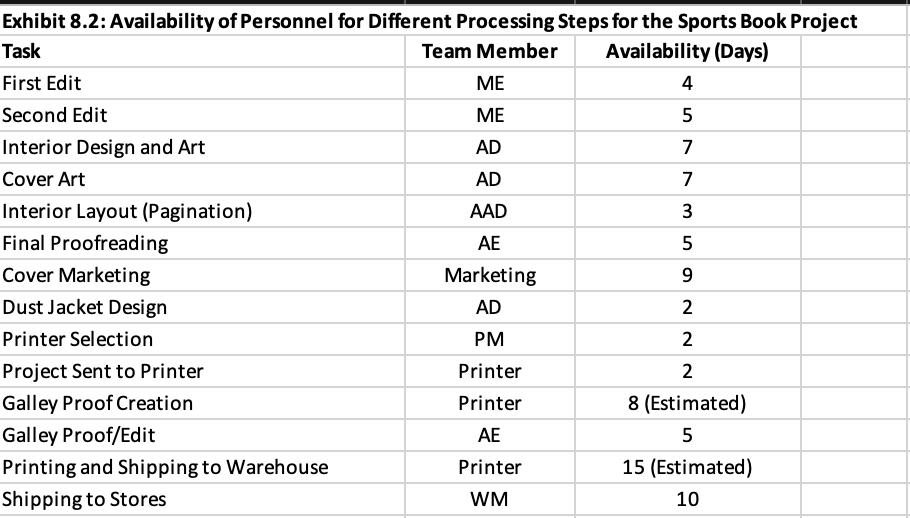
Exhibit 8.2: Availability of Personnel for Different Processing Steps for the Sports Book Project Task Team Member Availability (Days) First Edit Second Edit Interior Design and Art Cover Art Interior Layout (Pagination) Final Proofreading Cover Marketing Dust Jacket Design Printer Selection Project Sent to Printer Galley Proof Creation Galley Proof/Edit Printing and Shipping to Warehouse Shipping to Stores ME ME AD AD AAD AE Marketing AD PM Printer Printer AE Printer WM 4 5 7 7 3 5 9 2 2 2 8 (Estimated) 5 15 (Estimated) 10
Step by Step Solution
3.54 Rating (144 Votes )
There are 3 Steps involved in it
Networ... View full answer

Get step-by-step solutions from verified subject matter experts