Question: next next A company uses a single sampling plan to inspect the received lots from one of its suppliers. During the inspection, if a lot
next
next
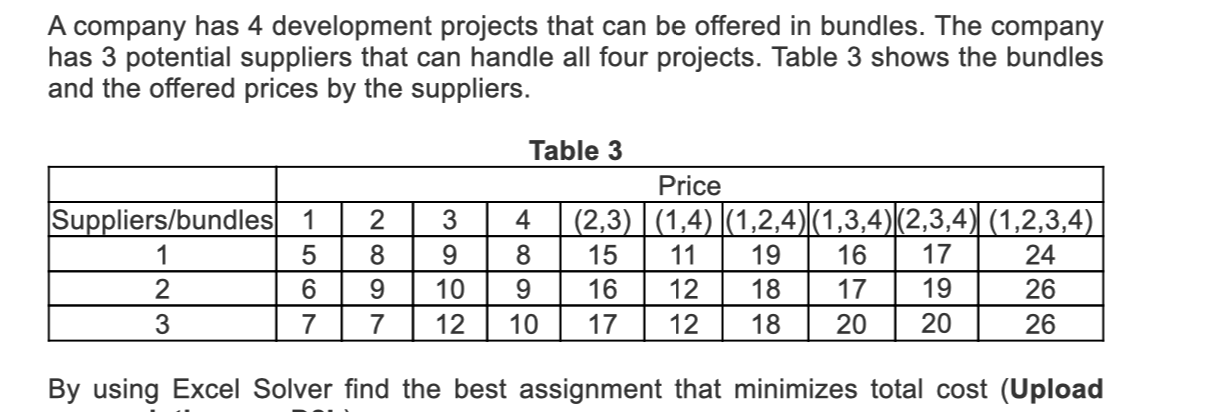
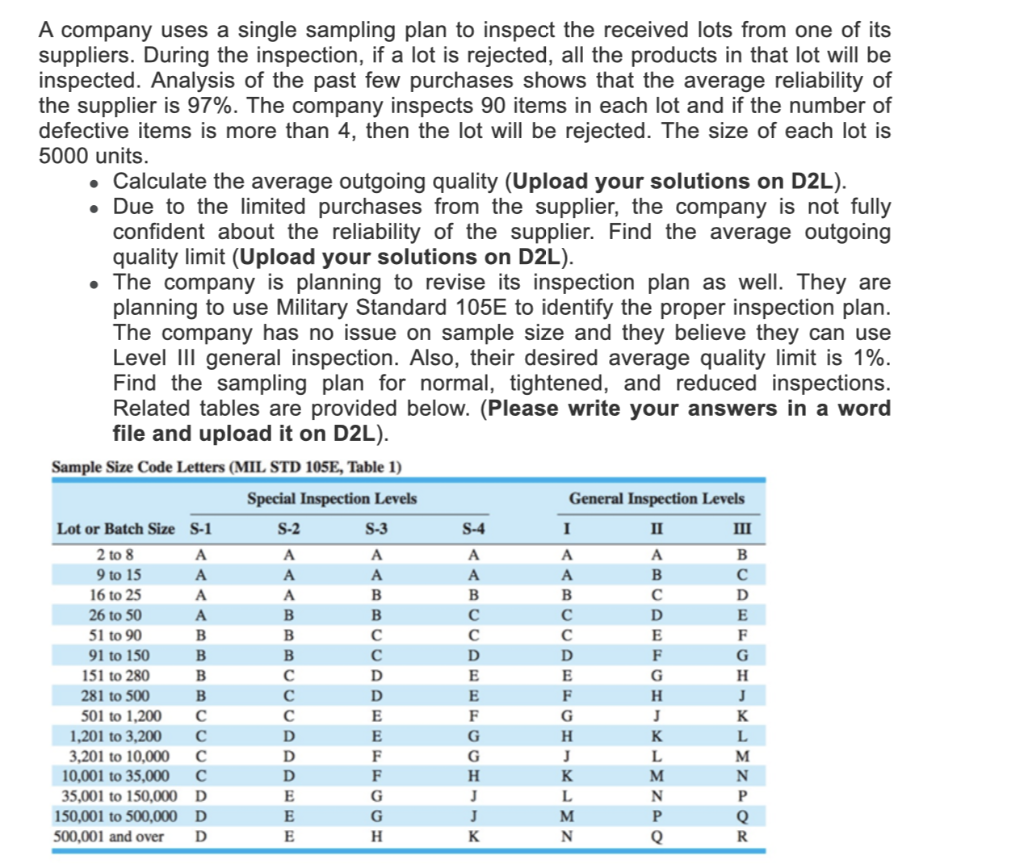
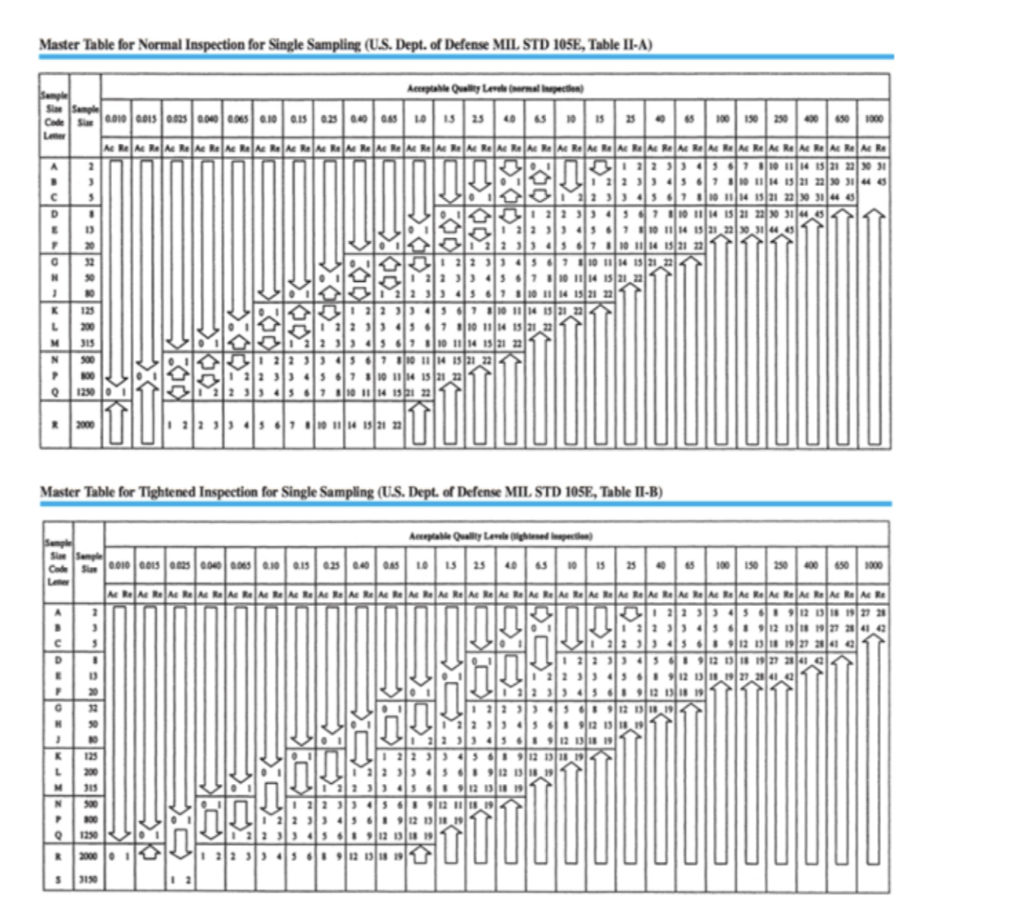
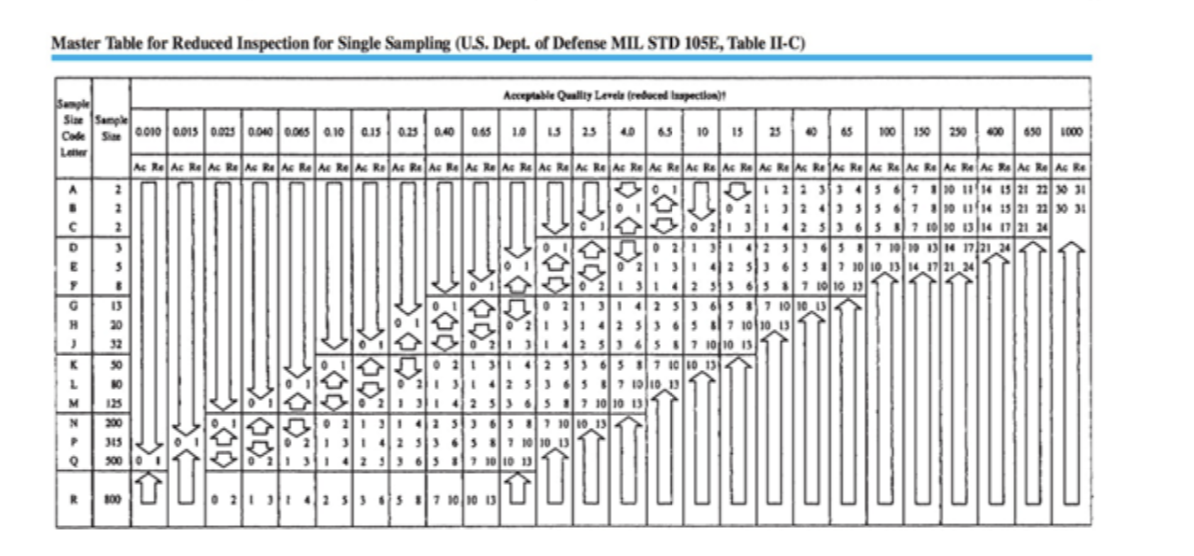
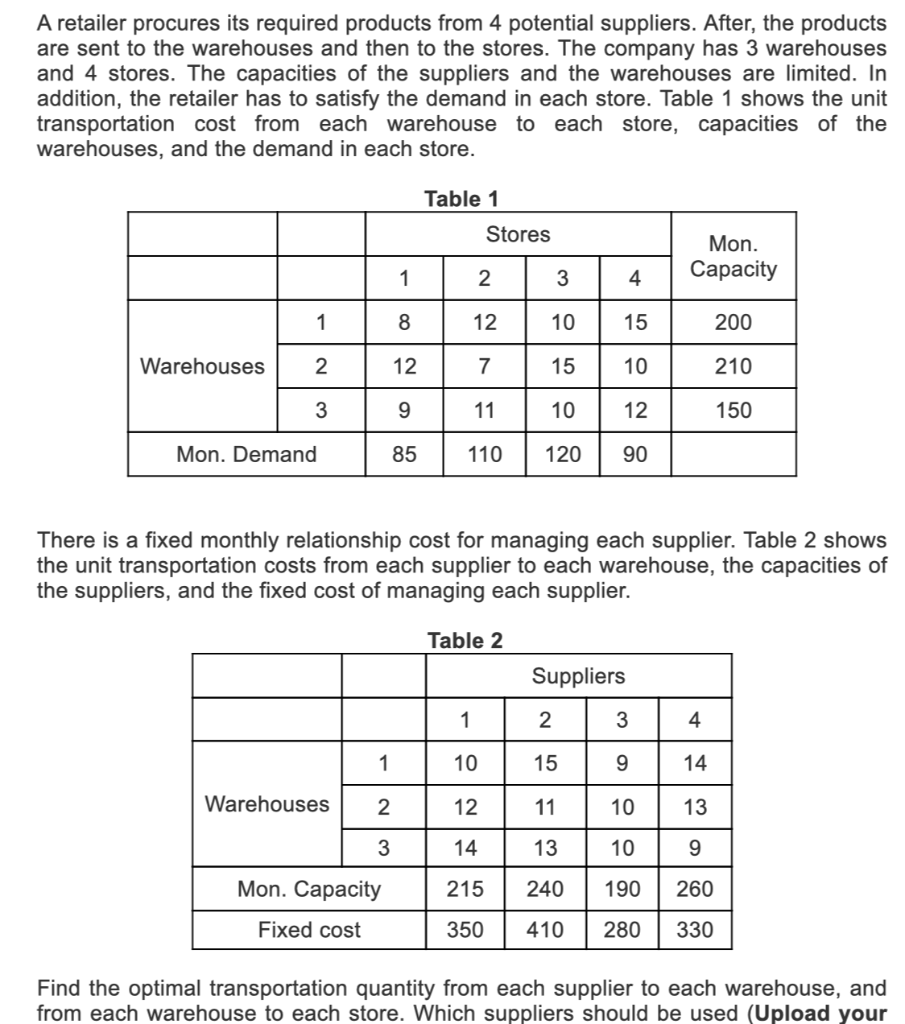
A company uses a single sampling plan to inspect the received lots from one of its suppliers. During the inspection, if a lot is rejected, all the products in that lot will be inspected. Analysis of the past few purchases shows that the average reliability of the supplier is 97%. The company inspects 90 items in each lot and if the number of defective items is more than 4, then the lot will be rejected. The size of each lot is 5000 units. Calculate the average outgoing quality (Upload your solutions on D2L). Due to the limited purchases from the supplier, the company is not fully confident about the reliability of the supplier. Find the average outgoing quality limit (Upload your solutions on D2L). The company is planning to revise its inspection plan as well. They are planning to use Military Standard 105E to identify the proper inspection plan. The company has no issue on sample size and they believe they can use Level III general inspection. Also, their desired average quality limit is 1%. Find the sampling plan for normal, tightened, and reduced inspections. Related tables are provided below. (Please write your answers in a word file and upload it on D2L). Sample Size Code Letters (MIL STD 105E, Table 1) Special Inspection Levels General Inspection Levels Lot or Batch Size S-1 S-2 S-4 2 to 8 A 9 to 15 A 16 to 25 A 26 to 50 51 to 90 B 91 to 150 B 151 to 280 B 281 to 500 B 501 to 1,200 1,201 to 3,200 3,201 to 10,000 10,001 to 35.000 35,001 to 150,000 D 150,001 to 500,000 D 500,001 and over D S-3 I II A A B A A A B B B D D D E E E A B B. D D E E F F G G H C D E E F G G H J J K A A B D E F G H J K L M N A B D E F G H J K L M N P B D E F G H J K L M N P Q R Q Master Table for Normal Inspection for Single Sampling (U.S. Dept. of Defense MIL STD 105E, Table II-A) 1000 See Aceptable Quality Leno mirna pection) So Sample Cone SW 010 01001101010 0101010 01 2012 NC RON Rome Re Re Re Re Re Re Re Re Re Re Re Re Re M ROM RON Rom Re Ne Re Re Re Re Re Re Re N ROME RE NE Re A R A R A R A RE 0 10 10 1521 20 31 10 15 21 24 | sa | 14 | 32 22 3 10 11 14 15 1014 13/11 10 11W 132 310 132 1014 13: 010 15 20 10 15 20 11 21 RR 21.0 od ol Tint 7.00 5sta 35 15/12 Master Table for Tightened Inspection for Single Sampling (US. Dept. of Defense MIL STD 105E, Table II-B) Acuptate Quality Lende tipe pe CAS010001001101010 0101023 10 2 -10 150 200 1000 Ne R A R A R A REAR REA RE RE ARE A R A R A R A R A R A R A R A R A R A R A R A R A R A R A R A R A R A Re SUN 1971 sa 12 ale 0912 1911 1912 a 4 20 1921 alus li 1.D 125 s 3190 Master Table for Reduced Inspection for Single Sampling (US. Dept. of Defense MIL STD 105E, Table II-C) Acceptable Qually Level rebeced lupection!! Sie Sample ) to | | ass are | on aansons 2 A 2 D |n uu is a n: : : : |: : : 1 : || nn nn nlal : : : : : : : | | :||| || 1 : 1| : 1 : 44: * - sos 1011013 : H :| 425507101013 900 50 M 110 33 315 274 26t: N P 0 10 :| : |::| name | | | | | A retailer procures its required products from 4 potential suppliers. After, the products are sent to the warehouses and then to the stores. The company has 3 warehouses and 4 stores. The capacities of the suppliers and the warehouses are limited. In addition, the retailer has to satisfy the demand in each store. Table 1 shows the unit transportation cost from each warehouse to each store, capacities of the warehouses, and the demand in each store. Table 1 Stores Mon. Capacity 1 2 3 4 1 8 12 15 200 Warehouses 2 12 7 15 10 210 3 9 11 10 12 150 Mon. Demand 85 110 120 90 There is a fixed monthly relationship cost for managing each supplier. Table 2 shows the unit transportation costs from each supplier to each warehouse, the capacities of the suppliers, and the fixed cost of managing each supplier. Table 2 Suppliers 1 2 3 4 1 10 15 9 14 Warehouses 2 12 11 10 13 3 14 13 10 9 Mon. Capacity 215 240 190 Fixed cost 350 410 280 330 Find the optimal transportation quantity from each supplier to each warehouse, and from each warehouse to each store. Which suppliers should be used (Upload your A company has 4 development projects that can be offered in bundles. The company has 3 potential suppliers that can handle all four projects. Table 3 shows the bundles and the offered prices by the suppliers. 2 8 Suppliers/bundles 1 1 5 2 6 3 7 3 9 10 12 Table 3 Price 4 (2,3)|(1,4)|(1,2,4)|(1,3,4) (2,3,4) (1,2,3,4) 8 15 11 19 16 17 24 19 26 10 17 12 18 20 20 26 7 By using Excel Solver find the best assignment that minimizes total cost (Upload A company uses a single sampling plan to inspect the received lots from one of its suppliers. During the inspection, if a lot is rejected, all the products in that lot will be inspected. Analysis of the past few purchases shows that the average reliability of the supplier is 97%. The company inspects 90 items in each lot and if the number of defective items is more than 4, then the lot will be rejected. The size of each lot is 5000 units. Calculate the average outgoing quality (Upload your solutions on D2L). Due to the limited purchases from the supplier, the company is not fully confident about the reliability of the supplier. Find the average outgoing quality limit (Upload your solutions on D2L). The company is planning to revise its inspection plan as well. They are planning to use Military Standard 105E to identify the proper inspection plan. The company has no issue on sample size and they believe they can use Level III general inspection. Also, their desired average quality limit is 1%. Find the sampling plan for normal, tightened, and reduced inspections. Related tables are provided below. (Please write your answers in a word file and upload it on D2L). Sample Size Code Letters (MIL STD 105E, Table 1) Special Inspection Levels General Inspection Levels Lot or Batch Size S-1 S-2 S-4 2 to 8 A 9 to 15 A 16 to 25 A 26 to 50 51 to 90 B 91 to 150 B 151 to 280 B 281 to 500 B 501 to 1,200 1,201 to 3,200 3,201 to 10,000 10,001 to 35.000 35,001 to 150,000 D 150,001 to 500,000 D 500,001 and over D S-3 I II A A B A A A B B B D D D E E E A B B. D D E E F F G G H C D E E F G G H J J K A A B D E F G H J K L M N A B D E F G H J K L M N P B D E F G H J K L M N P Q R Q Master Table for Normal Inspection for Single Sampling (U.S. Dept. of Defense MIL STD 105E, Table II-A) 1000 See Aceptable Quality Leno mirna pection) So Sample Cone SW 010 01001101010 0101010 01 2012 NC RON Rome Re Re Re Re Re Re Re Re Re Re Re Re Re M ROM RON Rom Re Ne Re Re Re Re Re Re Re N ROME RE NE Re A R A R A R A RE 0 10 10 1521 20 31 10 15 21 24 | sa | 14 | 32 22 3 10 11 14 15 1014 13/11 10 11W 132 310 132 1014 13: 010 15 20 10 15 20 11 21 RR 21.0 od ol Tint 7.00 5sta 35 15/12 Master Table for Tightened Inspection for Single Sampling (US. Dept. of Defense MIL STD 105E, Table II-B) Acuptate Quality Lende tipe pe CAS010001001101010 0101023 10 2 -10 150 200 1000 Ne R A R A R A REAR REA RE RE ARE A R A R A R A R A R A R A R A R A R A R A R A R A R A R A R A R A R A Re SUN 1971 sa 12 ale 0912 1911 1912 a 4 20 1921 alus li 1.D 125 s 3190 Master Table for Reduced Inspection for Single Sampling (US. Dept. of Defense MIL STD 105E, Table II-C) Acceptable Qually Level rebeced lupection!! Sie Sample ) to | | ass are | on aansons 2 A 2 D |n uu is a n: : : : |: : : 1 : || nn nn nlal : : : : : : : | | :||| || 1 : 1| : 1 : 44: * - sos 1011013 : H :| 425507101013 900 50 M 110 33 315 274 26t: N P 0 10 :| : |::| name | | | | | A retailer procures its required products from 4 potential suppliers. After, the products are sent to the warehouses and then to the stores. The company has 3 warehouses and 4 stores. The capacities of the suppliers and the warehouses are limited. In addition, the retailer has to satisfy the demand in each store. Table 1 shows the unit transportation cost from each warehouse to each store, capacities of the warehouses, and the demand in each store. Table 1 Stores Mon. Capacity 1 2 3 4 1 8 12 15 200 Warehouses 2 12 7 15 10 210 3 9 11 10 12 150 Mon. Demand 85 110 120 90 There is a fixed monthly relationship cost for managing each supplier. Table 2 shows the unit transportation costs from each supplier to each warehouse, the capacities of the suppliers, and the fixed cost of managing each supplier. Table 2 Suppliers 1 2 3 4 1 10 15 9 14 Warehouses 2 12 11 10 13 3 14 13 10 9 Mon. Capacity 215 240 190 Fixed cost 350 410 280 330 Find the optimal transportation quantity from each supplier to each warehouse, and from each warehouse to each store. Which suppliers should be used (Upload your A company has 4 development projects that can be offered in bundles. The company has 3 potential suppliers that can handle all four projects. Table 3 shows the bundles and the offered prices by the suppliers. 2 8 Suppliers/bundles 1 1 5 2 6 3 7 3 9 10 12 Table 3 Price 4 (2,3)|(1,4)|(1,2,4)|(1,3,4) (2,3,4) (1,2,3,4) 8 15 11 19 16 17 24 19 26 10 17 12 18 20 20 26 7 By using Excel Solver find the best assignment that minimizes total cost (Upload


