

No i just want that only step 3 has to he answered by tutor Compare these two
Fantastic news! We've Found the answer you've been seeking!
Question:
No i just want that only step 3 has to he answered by tutor
Compare these two graph and answer how did these major events reflect in the behavior of the alphabet inc.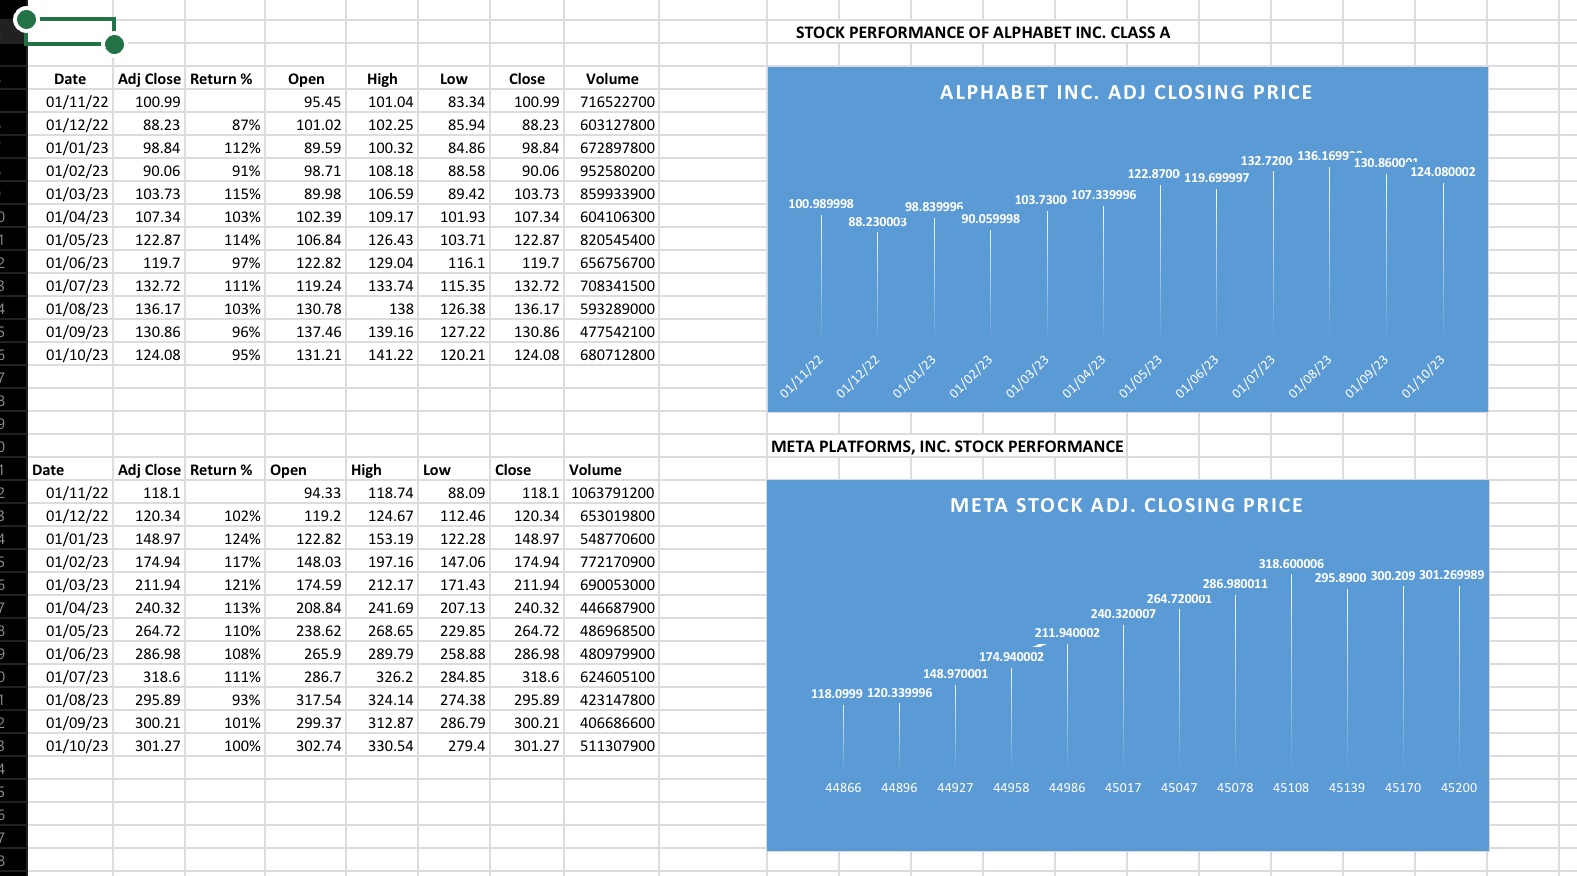
Transcribed Image Text:
Date Adj Close Return % 01/11/22 100.99 01/12/22 88.23 01/01/23 98.84 01/02/23 90.06 01/03/23 103.73 ) 01/04/23 107.34 1 01/05/23 122.87 01/06/23 119.7 3 01/07/23 132.72 2 4 01/08/23 136.17 01/09/23 130.86 01/10/23 124.08 5 7 3 3 1 Adj Close Return % Open 01/11/22 118.1 2 01/12/22 120.34 3 4 01/01/23 148.97 5 01/02/23 174.94 5 01/03/23 211.94 01/04/23 240.32 01/05/23 264.72 01/06/23 286.98 01/07/23 318.6 01/08/23 295.89 01/09/23 300.21 01/10/23 301.27 7 3 9 0 1 2 3 4 5 5 Open Volume Close 100.99 716522700 87% 112% 91% 115% 103% 114% High Low 95.45 101.04 83.34 101.02 102.25 85.94 88.23 603127800 89.59 100.32 84.86 98.84 672897800 98.71 108.18 88.58 90.06 952580200 89.98 106.59 89.42 103.73 859933900 102.39 109.17 101.93 126.43 103.71 107.34 604106300 122.87 820545400 97% 106.84 122.82 129.04 116.1 119.7 656756700 119.24 133.74 115.35 132.72 708341500 130.78 138 126.38 136.17 593289000 111% 103% 96% 137.46 139.16 127.22 95% 130.86 477542100 131.21 141.22 120.21 124.08 680712800 Date 7 3 Close Volume High 94.33 118.74 88.09 118.1 1063791200 119.2 124.67 112.46 120.34 653019800 122.82 153.19 122.28 148.97 548770600 148.03 197.16 147.06 174.94 772170900 174.59 212.17 171.43 211.94 690053000 208.84 241.69 207.13 240.32 446687900 102% 124% 117% 121% 113% 110% 108% 265.9 289.79 258.88 286.98 480979900 111% 286.7 326.2 284.85 318.6 624605100 93% 317.54 324.14 274.38 295.89 423147800 101% 299.37 312.87 286.79 300.21 406686600 100% 302.74 330.54 279.4 301.27 511307900 238.62 268.65 229.85 264.72 486968500 Low STOCK PERFORMANCE OF ALPHABET INC. CLASS A 100.989998 98.839996 88.230003 90.059998 N 01/11/22 01/12/22 ALPHABET INC. ADJ CLOSING PRICE 01/01/23 01/02/23 118.0999 120.339996 103.7300 107.339996 01/03/23 META PLATFORMS, INC. STOCK PERFORMANCE 148.970001 01/04/23 174.940002 122.8700 119.699997 211.940002 01/05/23 META STOCK ADJ. CLOSING PRICE 01/06/23 240.320007 132.7200 136.1699 264.720001 01/07/23 318.600006 286.980011 01/08/23 130.86001 01/09/23 124.080002 01/10/23 295.8900 300.209 301.269989 44866 44896 44927 44958 44986 45017 45047 45078 45108 45139 45170 45200 Date Adj Close Return % 01/11/22 100.99 01/12/22 88.23 01/01/23 98.84 01/02/23 90.06 01/03/23 103.73 ) 01/04/23 107.34 1 2 01/05/23 122.87 01/06/23 119.7 3 01/07/23 132.72 4 01/08/23 136.17 01/09/23 130.86 01/10/23 124.08 5 7 3 3 1 Adj Close Return % Open 01/11/22 118.1 2 01/12/22 120.34 3 4 01/01/23 148.97 5 01/02/23 174.94 5 01/03/23 211.94 01/04/23 240.32 01/05/23 264.72 01/06/23 286.98 01/07/23 318.6 01/08/23 295.89 01/09/23 300.21 01/10/23 301.27 7 3 9 0 1 2 3 4 5 5 Open Volume Close 100.99 716522700 87% 112% 91% 115% 103% 114% High Low 95.45 101.04 83.34 101.02 102.25 85.94 88.23 603127800 89.59 100.32 84.86 98.84 672897800 98.71 108.18 88.58 90.06 952580200 89.98 106.59 89.42 103.73 859933900 102.39 109.17 101.93 126.43 103.71 107.34 604106300 122.87 820545400 97% 106.84 122.82 129.04 116.1 119.7 656756700 119.24 133.74 115.35 132.72 708341500 130.78 138 126.38 136.17 593289000 111% 103% 96% 137.46 139.16 127.22 95% 130.86 477542100 131.21 141.22 120.21 124.08 680712800 Date 7 3 Close Volume High 94.33 118.74 88.09 118.1 1063791200 119.2 124.67 112.46 120.34 653019800 122.82 153.19 122.28 148.97 548770600 148.03 197.16 147.06 174.94 772170900 174.59 212.17 171.43 211.94 690053000 208.84 241.69 207.13 240.32 446687900 102% 124% 117% 121% 113% 110% 108% 265.9 289.79 258.88 286.98 480979900 111% 286.7 326.2 284.85 318.6 624605100 93% 317.54 324.14 274.38 295.89 423147800 101% 299.37 312.87 286.79 300.21 406686600 100% 302.74 330.54 279.4 301.27 511307900 238.62 268.65 229.85 264.72 486968500 Low STOCK PERFORMANCE OF ALPHABET INC. CLASS A 100.989998 98.839996 88.230003 90.059998 N 01/11/22 01/12/22 ALPHABET INC. ADJ CLOSING PRICE 01/01/23 01/02/23 118.0999 120.339996 103.7300 107.339996 01/03/23 META PLATFORMS, INC. STOCK PERFORMANCE 148.970001 01/04/23 174.940002 122.8700 119.699997 211.940002 01/05/23 META STOCK ADJ. CLOSING PRICE 01/06/23 240.320007 132.7200 136.1699 264.720001 01/07/23 318.600006 286.980011 01/08/23 130.86001 01/09/23 124.080002 01/10/23 295.8900 300.209 301.269989 44866 44896 44927 44958 44986 45017 45047 45078 45108 45139 45170 45200 Date Adj Close Return % 01/11/22 100.99 01/12/22 88.23 01/01/23 98.84 01/02/23 90.06 01/03/23 103.73 ) 01/04/23 107.34 1 01/05/23 122.87 01/06/23 119.7 3 01/07/23 132.72 2 4 01/08/23 136.17 01/09/23 130.86 01/10/23 124.08 5 7 3 3 1 Adj Close Return % Open 01/11/22 118.1 2 01/12/22 120.34 3 4 01/01/23 148.97 5 01/02/23 174.94 5 01/03/23 211.94 01/04/23 240.32 01/05/23 264.72 01/06/23 286.98 01/07/23 318.6 01/08/23 295.89 01/09/23 300.21 01/10/23 301.27 7 3 9 0 1 2 3 4 5 5 Open Volume Close 100.99 716522700 87% 112% 91% 115% 103% 114% High Low 95.45 101.04 83.34 101.02 102.25 85.94 88.23 603127800 89.59 100.32 84.86 98.84 672897800 98.71 108.18 88.58 90.06 952580200 89.98 106.59 89.42 103.73 859933900 102.39 109.17 101.93 126.43 103.71 107.34 604106300 122.87 820545400 97% 106.84 122.82 129.04 116.1 119.7 656756700 119.24 133.74 115.35 132.72 708341500 130.78 138 126.38 136.17 593289000 111% 103% 96% 137.46 139.16 127.22 95% 130.86 477542100 131.21 141.22 120.21 124.08 680712800 Date 7 3 Close Volume High 94.33 118.74 88.09 118.1 1063791200 119.2 124.67 112.46 120.34 653019800 122.82 153.19 122.28 148.97 548770600 148.03 197.16 147.06 174.94 772170900 174.59 212.17 171.43 211.94 690053000 208.84 241.69 207.13 240.32 446687900 102% 124% 117% 121% 113% 110% 108% 265.9 289.79 258.88 286.98 480979900 111% 286.7 326.2 284.85 318.6 624605100 93% 317.54 324.14 274.38 295.89 423147800 101% 299.37 312.87 286.79 300.21 406686600 100% 302.74 330.54 279.4 301.27 511307900 238.62 268.65 229.85 264.72 486968500 Low STOCK PERFORMANCE OF ALPHABET INC. CLASS A 100.989998 98.839996 88.230003 90.059998 N 01/11/22 01/12/22 ALPHABET INC. ADJ CLOSING PRICE 01/01/23 01/02/23 118.0999 120.339996 103.7300 107.339996 01/03/23 META PLATFORMS, INC. STOCK PERFORMANCE 148.970001 01/04/23 174.940002 122.8700 119.699997 211.940002 01/05/23 META STOCK ADJ. CLOSING PRICE 01/06/23 240.320007 132.7200 136.1699 264.720001 01/07/23 318.600006 286.980011 01/08/23 130.86001 01/09/23 124.080002 01/10/23 295.8900 300.209 301.269989 44866 44896 44927 44958 44986 45017 45047 45078 45108 45139 45170 45200 Date Adj Close Return % 01/11/22 100.99 01/12/22 88.23 01/01/23 98.84 01/02/23 90.06 01/03/23 103.73 ) 01/04/23 107.34 1 2 01/05/23 122.87 01/06/23 119.7 3 01/07/23 132.72 4 01/08/23 136.17 01/09/23 130.86 01/10/23 124.08 5 7 3 3 1 Adj Close Return % Open 01/11/22 118.1 2 01/12/22 120.34 3 4 01/01/23 148.97 5 01/02/23 174.94 5 01/03/23 211.94 01/04/23 240.32 01/05/23 264.72 01/06/23 286.98 01/07/23 318.6 01/08/23 295.89 01/09/23 300.21 01/10/23 301.27 7 3 9 0 1 2 3 4 5 5 Open Volume Close 100.99 716522700 87% 112% 91% 115% 103% 114% High Low 95.45 101.04 83.34 101.02 102.25 85.94 88.23 603127800 89.59 100.32 84.86 98.84 672897800 98.71 108.18 88.58 90.06 952580200 89.98 106.59 89.42 103.73 859933900 102.39 109.17 101.93 126.43 103.71 107.34 604106300 122.87 820545400 97% 106.84 122.82 129.04 116.1 119.7 656756700 119.24 133.74 115.35 132.72 708341500 130.78 138 126.38 136.17 593289000 111% 103% 96% 137.46 139.16 127.22 95% 130.86 477542100 131.21 141.22 120.21 124.08 680712800 Date 7 3 Close Volume High 94.33 118.74 88.09 118.1 1063791200 119.2 124.67 112.46 120.34 653019800 122.82 153.19 122.28 148.97 548770600 148.03 197.16 147.06 174.94 772170900 174.59 212.17 171.43 211.94 690053000 208.84 241.69 207.13 240.32 446687900 102% 124% 117% 121% 113% 110% 108% 265.9 289.79 258.88 286.98 480979900 111% 286.7 326.2 284.85 318.6 624605100 93% 317.54 324.14 274.38 295.89 423147800 101% 299.37 312.87 286.79 300.21 406686600 100% 302.74 330.54 279.4 301.27 511307900 238.62 268.65 229.85 264.72 486968500 Low STOCK PERFORMANCE OF ALPHABET INC. CLASS A 100.989998 98.839996 88.230003 90.059998 N 01/11/22 01/12/22 ALPHABET INC. ADJ CLOSING PRICE 01/01/23 01/02/23 118.0999 120.339996 103.7300 107.339996 01/03/23 META PLATFORMS, INC. STOCK PERFORMANCE 148.970001 01/04/23 174.940002 122.8700 119.699997 211.940002 01/05/23 META STOCK ADJ. CLOSING PRICE 01/06/23 240.320007 132.7200 136.1699 264.720001 01/07/23 318.600006 286.980011 01/08/23 130.86001 01/09/23 124.080002 01/10/23 295.8900 300.209 301.269989 44866 44896 44927 44958 44986 45017 45047 45078 45108 45139 45170 45200
Expert Answer:
Answer rating: 100% (QA)
The graphs are a comparison of the stock performance of Alphabet Inc and Meta Platforms Inc from January 11 2022 to October 10 2023 Here are some of t... View the full answer

Related Book For 

Income Tax Fundamentals 2013
ISBN: 9781285586618
31st Edition
Authors: Gerald E. Whittenburg, Martha Altus Buller, Steven L Gill
Posted Date:
Students also viewed these accounting questions
-
Answer Problem 6.52 for 1 lb rather than 0.5 lb? Obstetrics Figure 6.4b (p. 172) plotted the sampling distribution of the mean from 200 samples of size 5 from the population of 1000 birth-weights...
-
Compare your results in Problems 6.52 and 6.53 with the actual proportion of sample means that fall in these ranges? Obstetrics Figure 6.4b (p. 172) plotted the sampling distribution of the mean from...
-
How do the actual sample results in Problems 6.48 and 6.49 compare? Obstetrics Figure 6.4b (p. 172) plotted the sampling distribution of the mean from 200 samples of size 5 from the population of...
-
Good Morning Food, Inc. is using the profitability index (PI) when evaluating projects. You have to find the PI for the company's project, assuming the company's cost of capital is 14.29 percent. The...
-
Franklin Fabricators completed two jobs in June. Franklin recorded the following costs assigned to the jobs by the company's activity-based costing system: Job 622 required 2,500 parts, 62,500 lathe...
-
Where is supply more elastic, Las Vegas or San Francisco? In 2009 a popular proposal to deal with the fall in housing prices was for the federal government to raise the demand curve for houses by...
-
External and internal costs: a How do external and internal environmental costs differ? Provide three examples of an external, and four examples of an internal, environmental cost. In your examples...
-
Suresh Co. expects its five departments to yield the following income for next year. Recompute and prepare the departmental income statements (including a combined total column) for the company under...
-
Amman Manufacturing Company is producing three products all of which require the same production facilities. Financial data on the three products are as follows: Costs Direct Labor Cost per unit...
-
Elwood is a pig farmer who is known to enjoy a drink or two. One day in July, after a weekend of particularly heavy drinking, he staggered into the office of Pork Bellies of America and offered to...
-
Hello! Assignemnt Leadership. Please answer with references! Question: The future of work is becoming more flexible. What are some of the challenges leaders may face with this new way of working? ...
-
A body vibrating with viscous damping makes five complete oscillations per second, and in 50 cycles its amplitude diminishes to \(10 \%\). Determine the logarithmic decrement and the damping ratio....
-
Is the phase angle corresponding to the peak amplitude of a viscously damped system ever larger than \(90^{\circ}\) ?
-
What are the amplitude and the phase angle of the response of a viscously damped system in the neighborhood of resonance?
-
What is the frequency of the response of a viscously damped system when the external force is \(F_{0} \sin \omega t\) ? Is this response harmonic?
-
Lines parallel to imaginary axis a. Different values of damped natural frequency b. Different values of reciprocals of time constant c. Different values of damping ratio d. Different values of...
-
A material is subjected to a state of hydrostatic stress of 01 02 03 = 200 MPa. Determine the von Mises stress (MPa).
-
In muscle tissue, the ratio of phosphorylase a to phosphorylase b determines the rate of conversion of glycogen to glucose 1phosphate. Classify how each event affects the rate of glycogen breakdown...
-
Yolanda is a cash basis taxpayer with the following transactions during the year: Cash received from sales of products........................................................................$65,000...
-
Abigail (Abby) Boxer is a single mother working as a civilian accountant for the U.S. Army. Her Social Security number is 676-73-3311 and she lives at 3456 Alamo Way, San Antonio, TX 78249. Helen,...
-
The following additional information is available for the Dr. Ivan and Irene Incisor family from Chapters 1 and 2. On September 1, Irene opened a retail store that specializes in sports car...
-
An important measure of profitability is a. inventory turnover. b. quick (acid test) ratio. c. return on assets (ROA). d. net sales.
-
Which item among the following is not an intangible asset? a. A trademark b. A copyright c. A patent d. All of the above are intangible assets
-
In 2020, return on assets for JBC Company has increased. This means that the a. company has become more effective. b. company has become more efficient. c. company has become more effective and more...

Study smarter with the SolutionInn App