

Question: No need to draw graph just need coordinates please Year Inflation Rate Unemployment Rate (% ) (%) 2018 4.8 5.8 2019 2.7 9.0 2020 3.6
No need to draw graph just need coordinates please
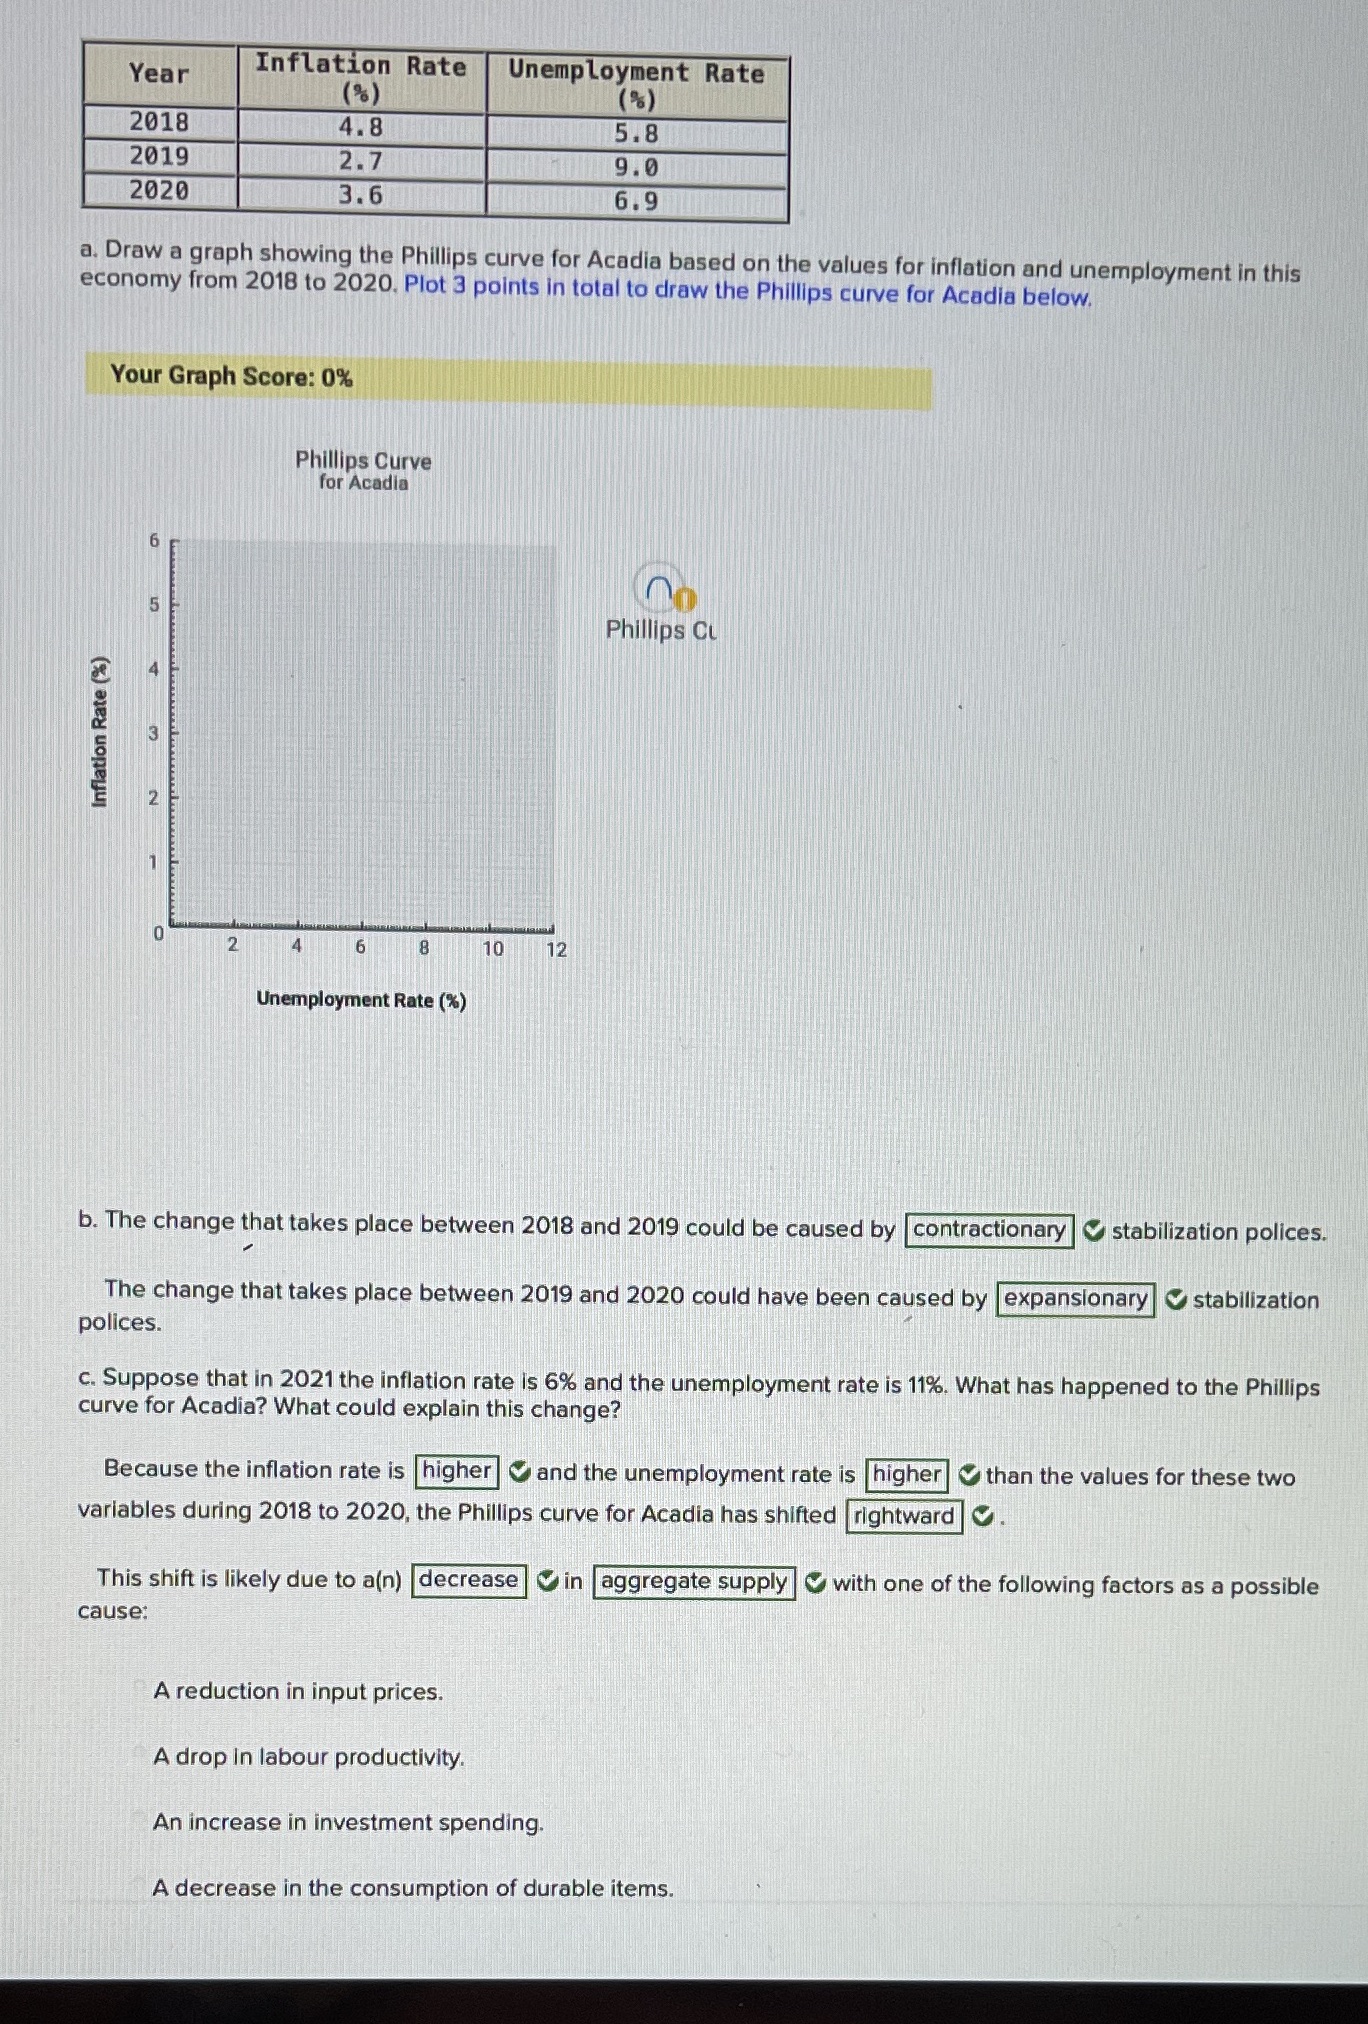
Year Inflation Rate Unemployment Rate (% ) (%) 2018 4.8 5.8 2019 2.7 9.0 2020 3.6 6.9 a. Draw a graph showing the Phillips curve for Acadia based on the values for inflation and unemployment in this economy from 2018 to 2020. Plot 3 points in total to draw the Phillips curve for Acadia below. Your Graph Score: 0% Phillips Curve for Acadia Phillips CL A Inflation Rate (%) N 6 8 10 12 Unemployment Rate (x) b. The change that takes place between 2018 and 2019 could be caused by |contractionary @ stabilization polices. The change that takes place between 2019 and 2020 could have been caused by |expansionary @ stabilization polices. c. Suppose that in 2021 the inflation rate is 6% and the unemployment rate is 11%. What has happened to the Phillips curve for Acadia? What could explain this change? Because the inflation rate is higher @ and the unemployment rate is higher @ than the values for these two variables during 2018 to 2020, the Phillips curve for Acadia has shifted |rightward| This shift is likely due to a(n) |decrease @ in |aggregate supply @ with one of the following factors as a possible cause: A reduction in input prices. A drop In labour productivity. An increase in investment spending. A decrease in the consumption of durable items
Step by Step Solution
There are 3 Steps involved in it

Get step-by-step solutions from verified subject matter experts