

Question: Normal Distributions Worksheet 1 Draw the histogram corresponding with the following data Describe the shape of the distribution Heights of Women (inches) Frequency 56.0-57.9
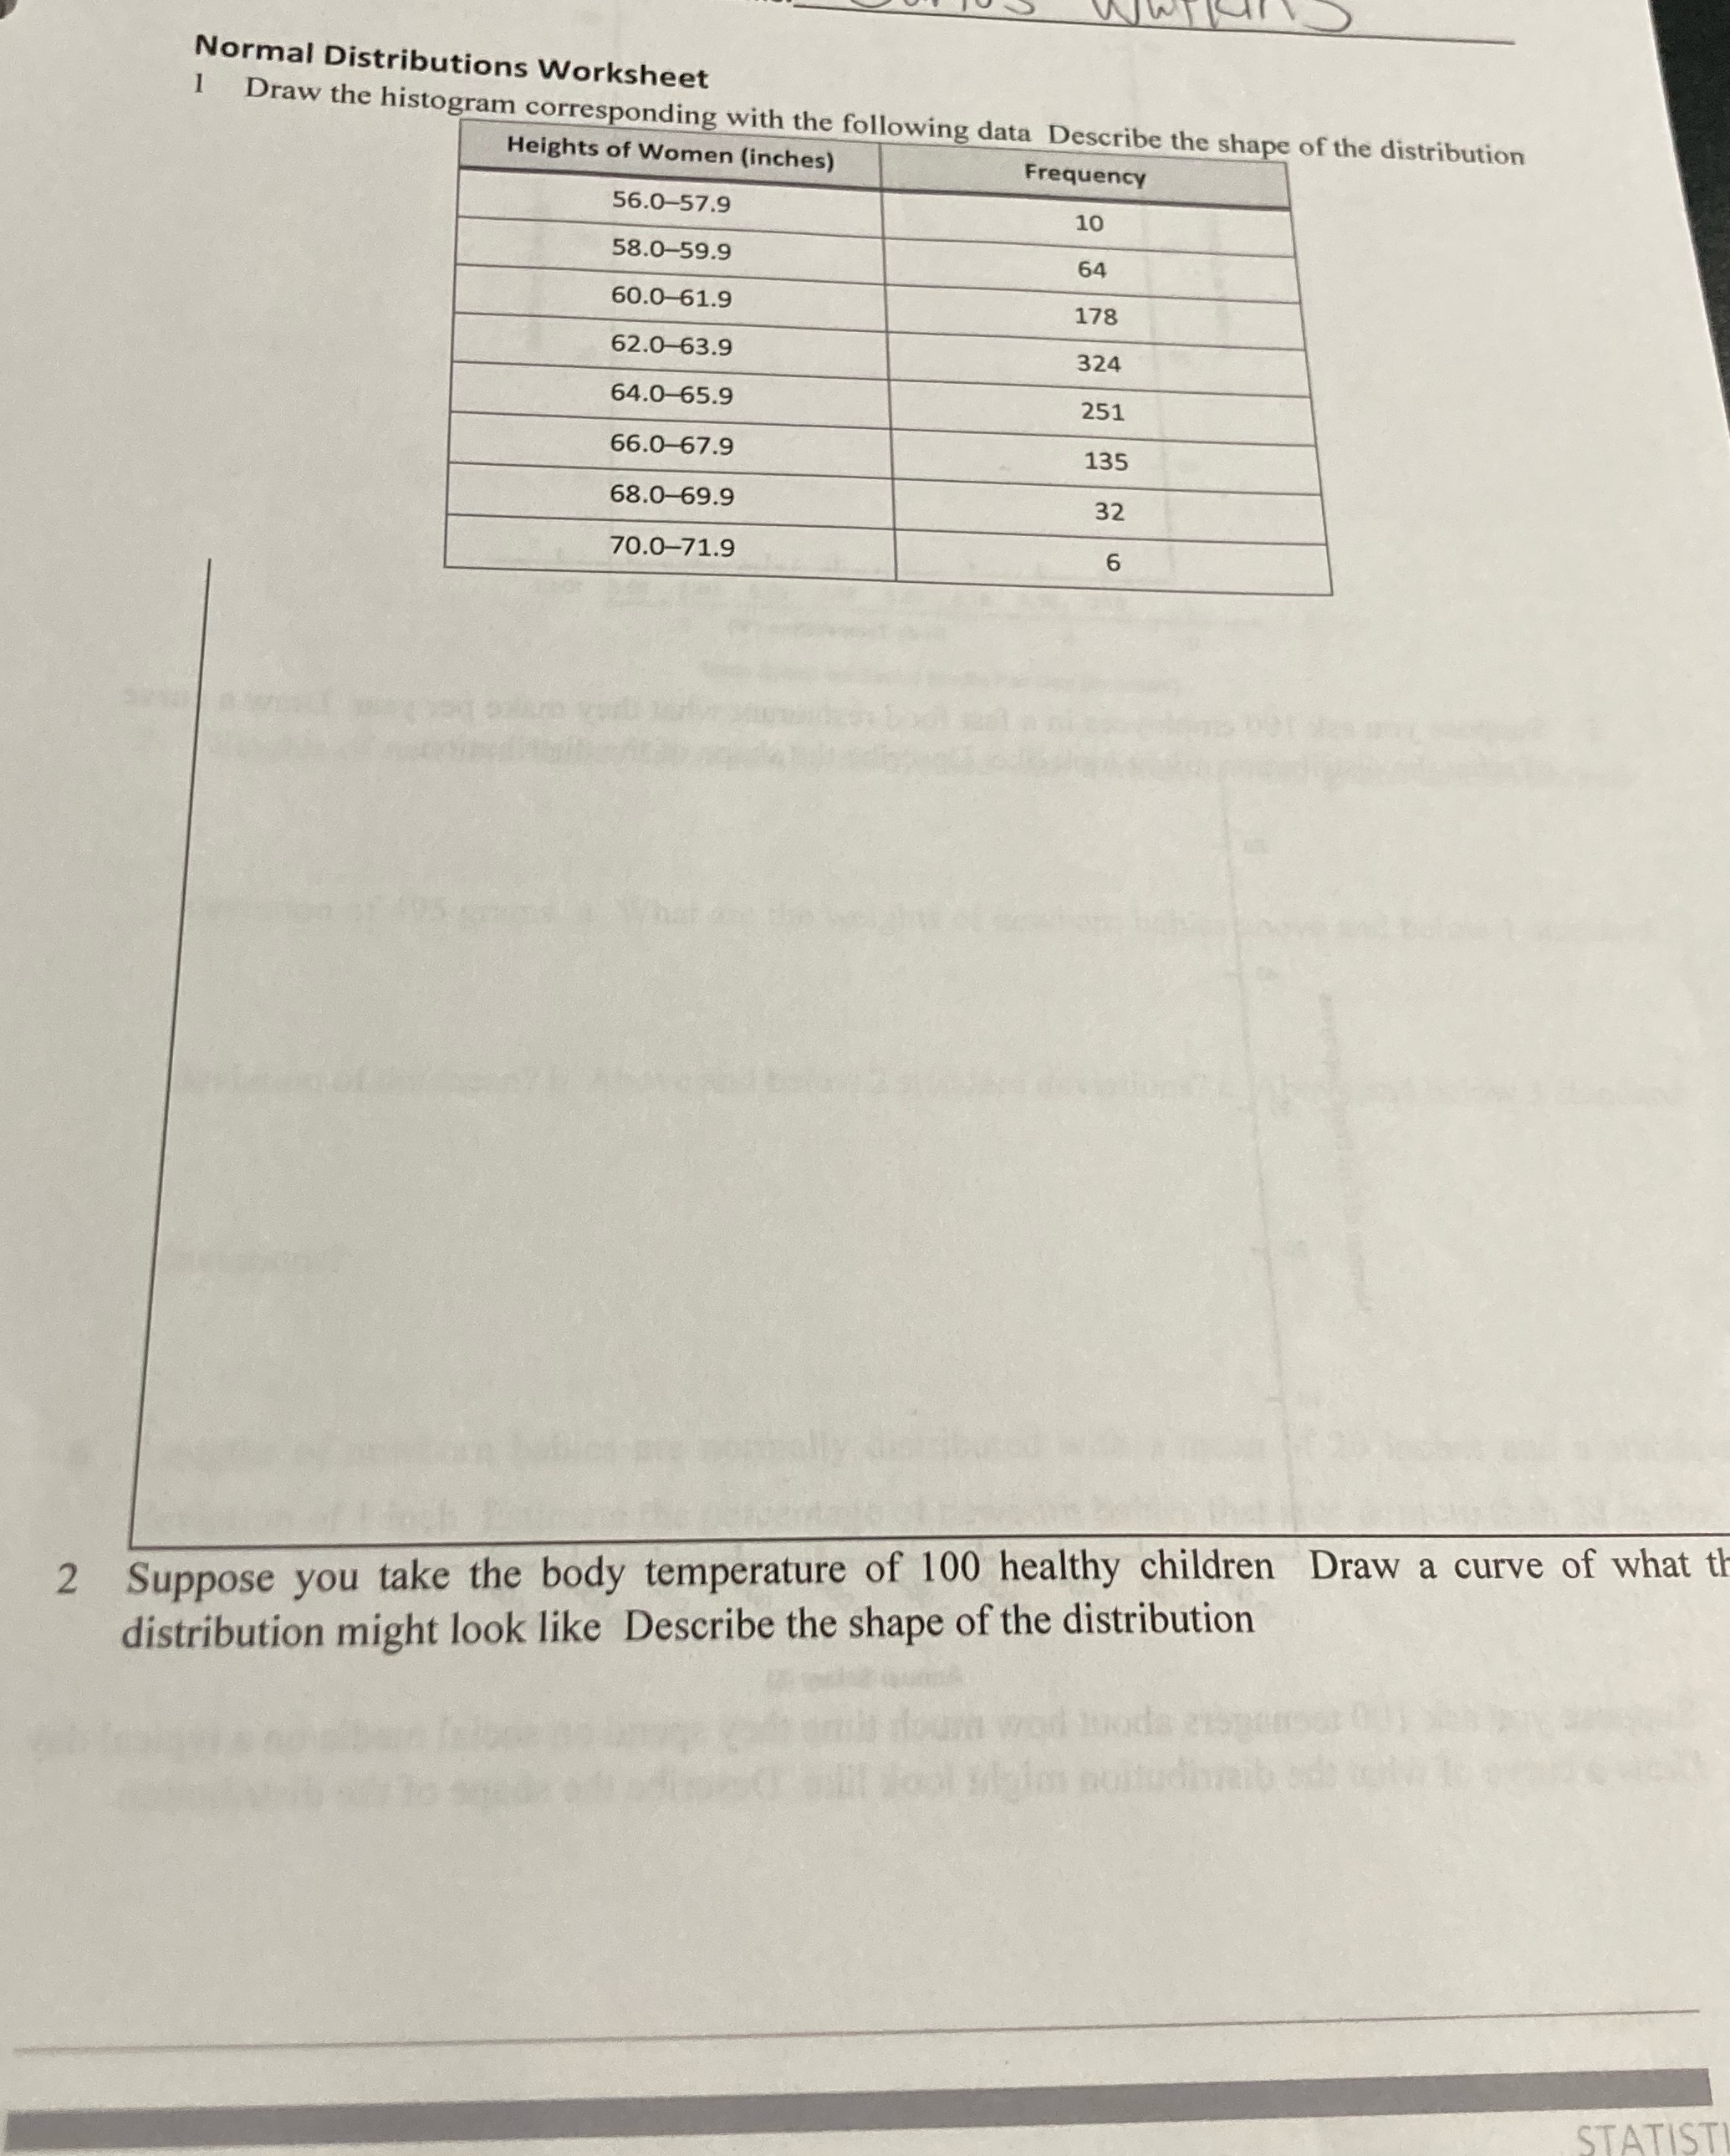
Normal Distributions Worksheet 1 Draw the histogram corresponding with the following data Describe the shape of the distribution Heights of Women (inches) Frequency 56.0-57.9 10 58.0-59.9 64 60.0-61.9 178 62.0-63.9 324 64.0-65.9 251 66.0-67.9 135 68.0-69.9 32 70.0-71.9 6 2 Suppose you take the body temperature of 100 healthy children Draw a curve of what th distribution might look like Describe the shape of the distribution STATIST
Step by Step Solution
There are 3 Steps involved in it
1 Expert Approved Answer
Step: 1 Unlock

Question Has Been Solved by an Expert!
Get step-by-step solutions from verified subject matter experts
Step: 2 Unlock
Step: 3 Unlock