

Question: Normally, we would want to check that the response variable varies normally within each of the populations. Which of the following is most true? The

Normally, we would want to check that the "response variablevaries normallywithin each of the populations." Which of the following is most true?
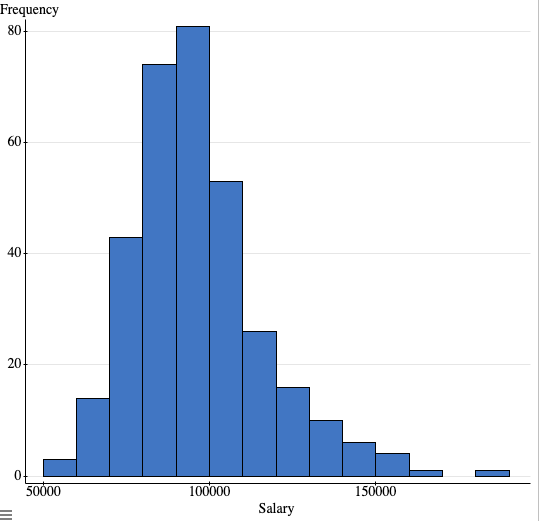
- The three histograms look mostly normal. A couple of them might have outliers
- The three histograms look mostly normal and all three have clear outliers
- All three of the histograms look like the perfectly conform to a normal curve
- None of the three histograms looks anything like a normal curve
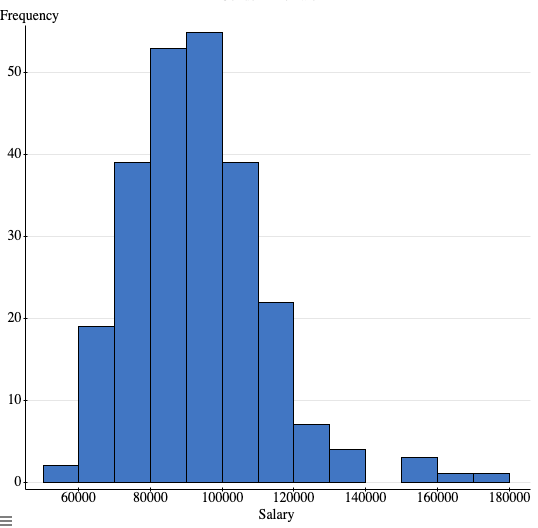

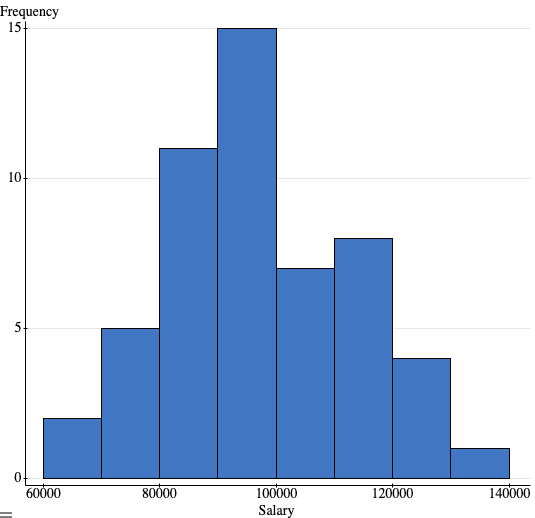
Frequency 50- 40- 30- 20- 10 60000 80000 100000 120000 140000 160000 180000 SalaryFrequency 80 60- 40- 20 50000 100000 150000 SalaryFrequency 154 10 5. 60000 80000 100000 120000 140000 Salary
Step by Step Solution
There are 3 Steps involved in it
1 Expert Approved Answer
Step: 1 Unlock

Question Has Been Solved by an Expert!
Get step-by-step solutions from verified subject matter experts
Step: 2 Unlock
Step: 3 Unlock