

Question: (Note: for the following question, show both final solution and the Matlab command input and output) 1. (14.14) An investigator has reported the data tabulated
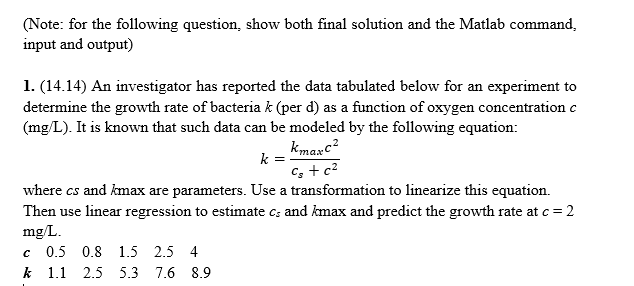
(Note: for the following question, show both final solution and the Matlab command input and output) 1. (14.14) An investigator has reported the data tabulated below for an experiment to determine the growth rate of bacteria k (per d) as a function of oxygen concentration c (mg/L). It is known that such data can be modeled by the following equation: kmarc2 where cs and kmax are parameters. Use a transformation to linearize this equation. Then use linear regression to estimate c and kmax and predict the growth rate at c 2 mg/L c 0.5 0.8 15 2.5 4 k 1.1 2.5 5.3 7.6 8.9
Step by Step Solution
There are 3 Steps involved in it
1 Expert Approved Answer
Step: 1 Unlock

Question Has Been Solved by an Expert!
Get step-by-step solutions from verified subject matter experts
Step: 2 Unlock
Step: 3 Unlock