

Question: NOTE: matlab question. please write your code and share your code's photo. thanks. 3) Consider the function f(x) = In (x). For x = [0.1,
NOTE: matlab question. please write your code and share your code's photo. thanks.
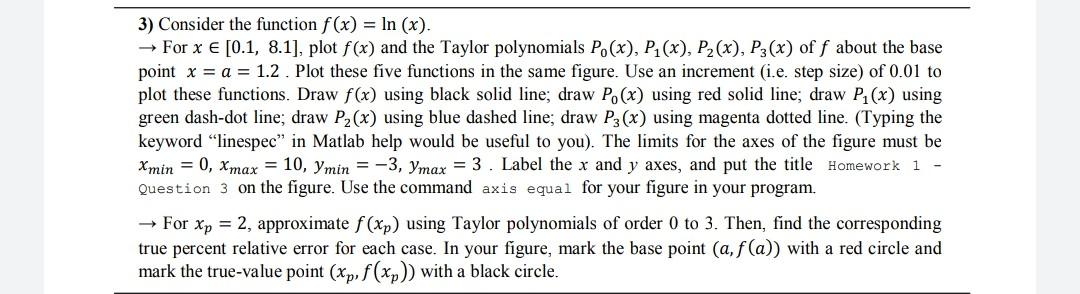
3) Consider the function f(x) = In (x). For x = [0.1, 8.1], plot f(x) and the Taylor polynomials P.(x), P1(x), P2(x), P3(x) off about the base point x = a = 1.2. Plot these five functions in the same figure. Use an increment (i.e. step size) of 0.01 to plot these functions. Draw f(x) using black solid line; draw P. (x) using red solid line; draw P1(x) using green dash-dot line; draw P2(x) using blue dashed line; draw P3(x) using magenta dotted line. (Typing the keyword "linespec" in Matlab help would be useful to you). The limits for the axes of the figure must be Xmin = 0, Xmax = 10, Ymin = -3, Ymax = 3. Label the x and y axes, and put the title Homework 1 Question 3 on the figure. Use the command axis equal for your figure in your program. For Xp = 2, approximate f(xp) using Taylor polynomials of order 0 to 3. Then, find the corresponding true percent relative error for each case. In your figure, mark the base point (a, f(a)) with a red circle and mark the true-value point (Xp, f(xp)) with a black circle
Step by Step Solution
There are 3 Steps involved in it

Get step-by-step solutions from verified subject matter experts