

Question: NOTE: - Probably both lines will overlap. Therefore, use different line styles (one solid, one dashed for instance) - Place the screenshot of the integration
 NOTE:
NOTE:
- Probably both lines will overlap. Therefore, use different line styles (one solid, one dashed for instance)
- Place the screenshot of the integration result for each function corresponding to = 600
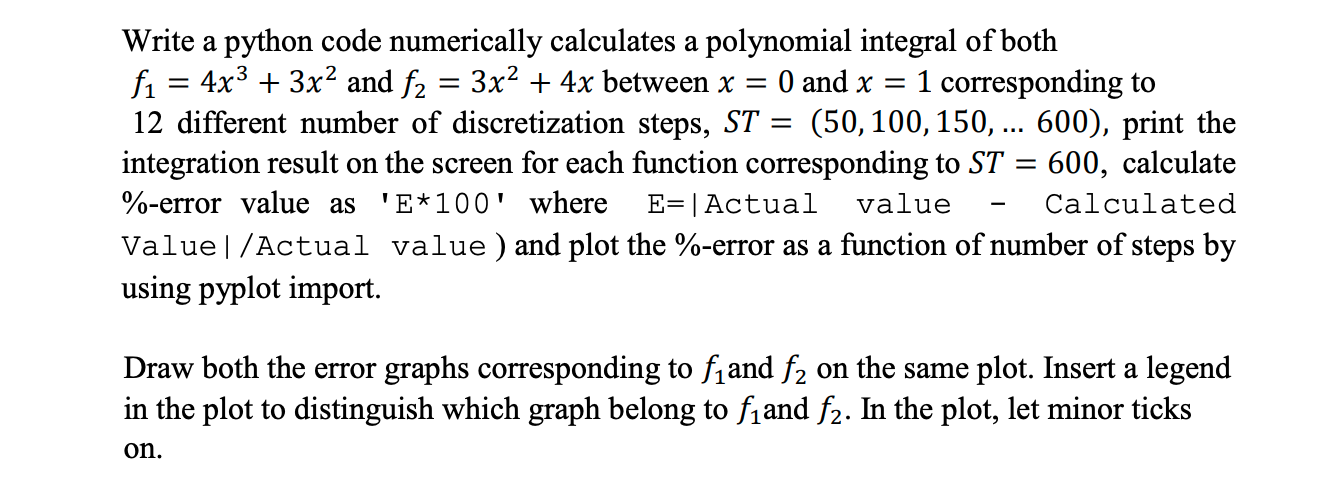
Write a python code numerically calculates a polynomial integral of both f1 = 4x3 + 3x2 and f2 = 3x2 + 4x between x O and x = 1 corresponding to 12 different number of discretization steps, ST = (50, 100, 150, ... 600), print the integration result on the screen for each function corresponding to ST = 600, calculate %-error value as 'E*100' where E=|Actual value Calculated Value/Actual value ) and plot the %-error as a function of number of steps by using pyplot import. Draw both the error graphs corresponding to fiand f2 on the same plot. Insert a legend in the plot to distinguish which graph belong to fiand f2. In the plot, let minor ticks on
Step by Step Solution
There are 3 Steps involved in it

Get step-by-step solutions from verified subject matter experts