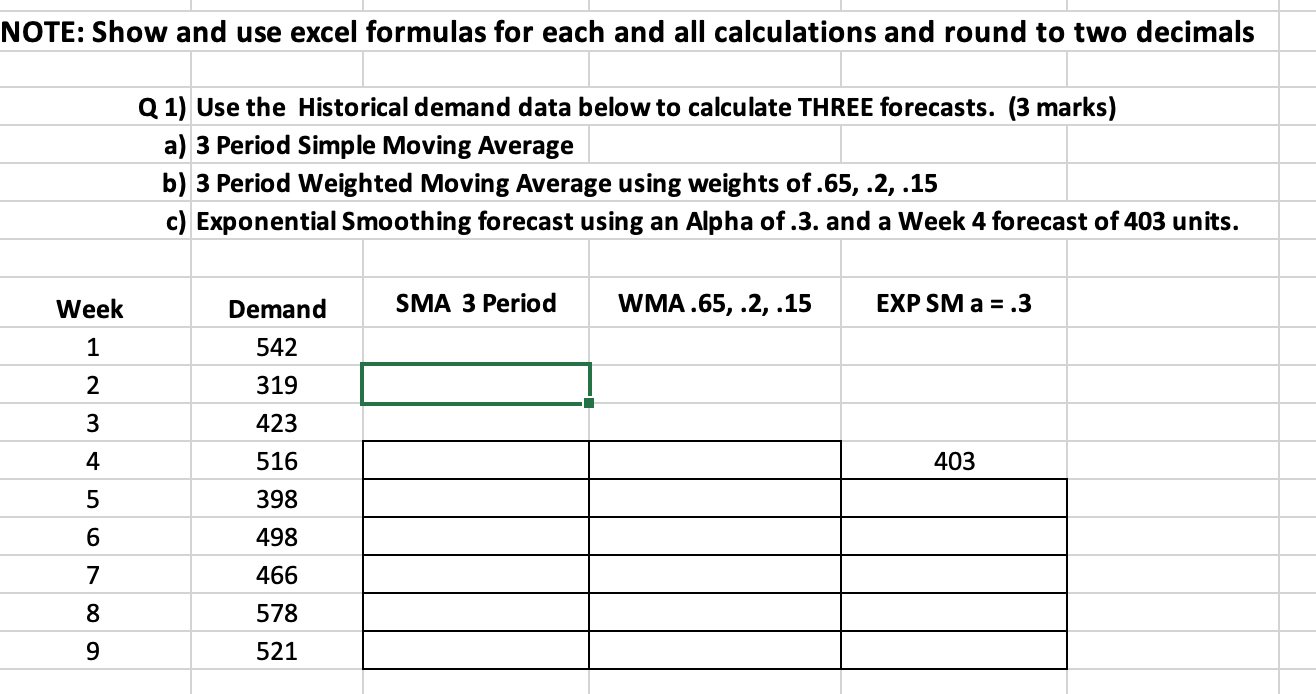
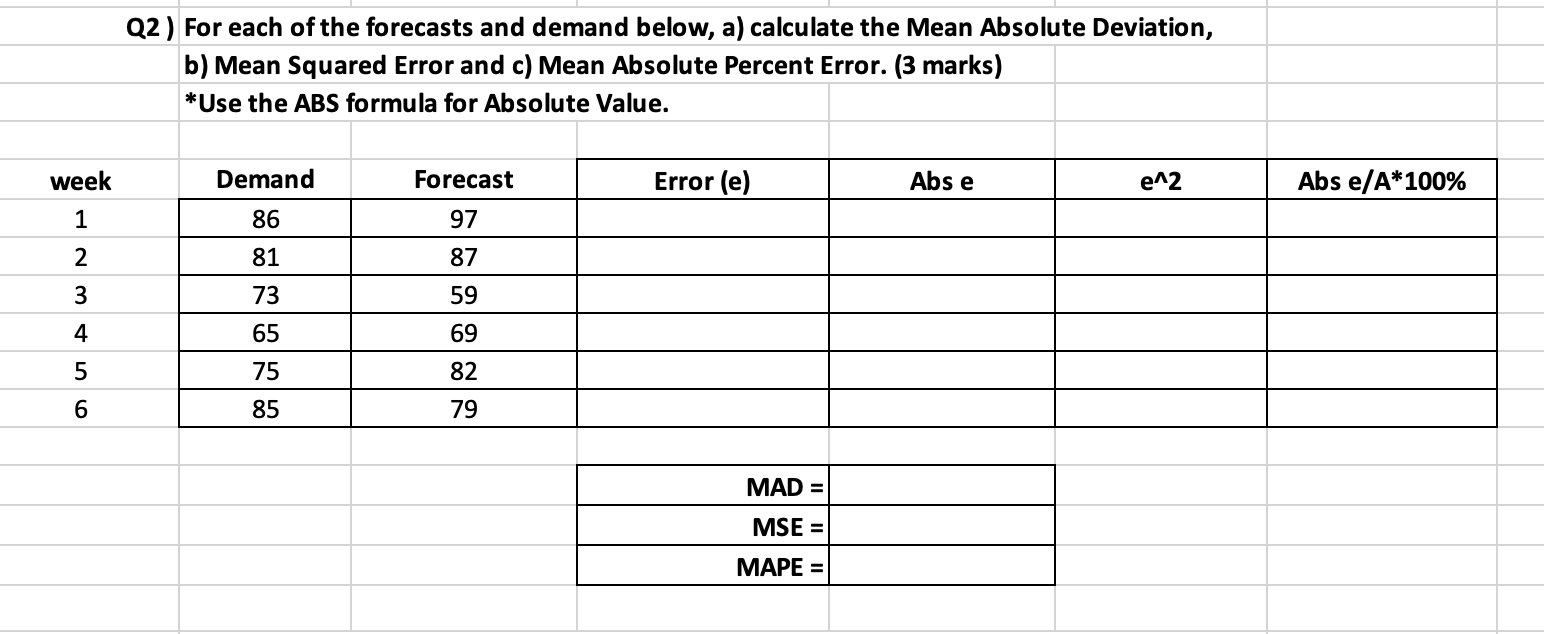
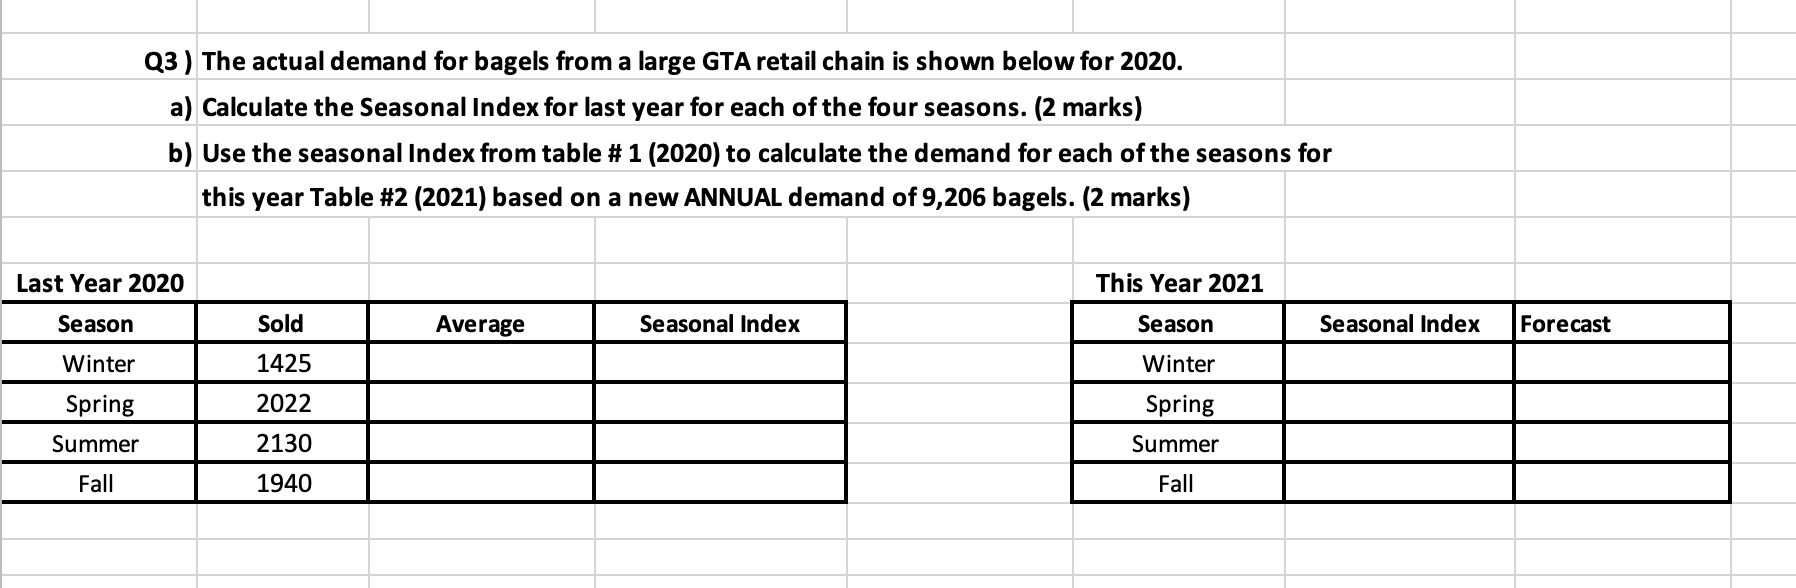
Question: NOTE: Show and use excel formulas for each and all calculations and round to two decimals Q 1) Use the Historical demand data below to

NOTE: Show and use excel formulas for each andNOTE: Show and use excel formulas for each andNOTE: Show and use excel formulas for each andNOTE: Show and use excel formulas for each and

NOTE: Show and use excel formulas for each and all calculations and round to two decimals Q 1) Use the Historical demand data below to calculate THREE forecasts. (3 marks) a) 3 Period Simple Moving Average b) 3 Period Weighted Moving Average using weights of.65, .2, .15 c) Exponential Smoothing forecast using an Alpha of.3. and a Week 4 forecast of 403 units. Week Demand SMA 3 Period WMA.65, .2, .15 EXP SM a = .3 1 542 319 Nm + 423 516 403 5 398 6 498 7 466 8 578 9 521 Q2 ) For each of the forecasts and demand below, a) calculate the Mean Absolute Deviation, b) Mean Squared Error and c) Mean Absolute Percent Error. (3 marks) *Use the ABS formula for Absolute Value. week Demand Forecast Error (e) Abs e e^2 Abs e/A*100% 1 86 97 2 81 87 3 73 59 4 65 69 5 75 82 6 85 79 MAD = MSE = MAPE = Q3) The actual demand for bagels from a large GTA retail chain is shown below for 2020. a) Calculate the Seasonal Index for last year for each of the four seasons. (2 marks) b) Use the seasonal Index from table # 1 (2020) to calculate the demand for each of the seasons for this year Table #2 (2021) based on a new ANNUAL demand of 9,206 bagels. (2 marks) Last Year 2020 This Year 2021 Season Sold Average Seasonal Index Season Seasonal Index Forecast Winter 1425 Winter Spring 2022 Spring Summer 2130 Summer Fall 1940 Fall PLEASE SHOW ME THE ANSWERS WITH THE EXCEL FORMULAS

Step by Step Solution

There are 3 Steps involved in it

1 Expert Approved Answer
Step: 1 Unlock blur-text-image
Question Has Been Solved by an Expert!

Get step-by-step solutions from verified subject matter experts

Step: 2 Unlock
Step: 3 Unlock

Students Have Also Explored These Related General Management Questions!