

Question: Note: the 2018 1. Complete the table below by calculating the missing performance measures for the Illini Tap. Calculate liquidity and solvency measures for 2018
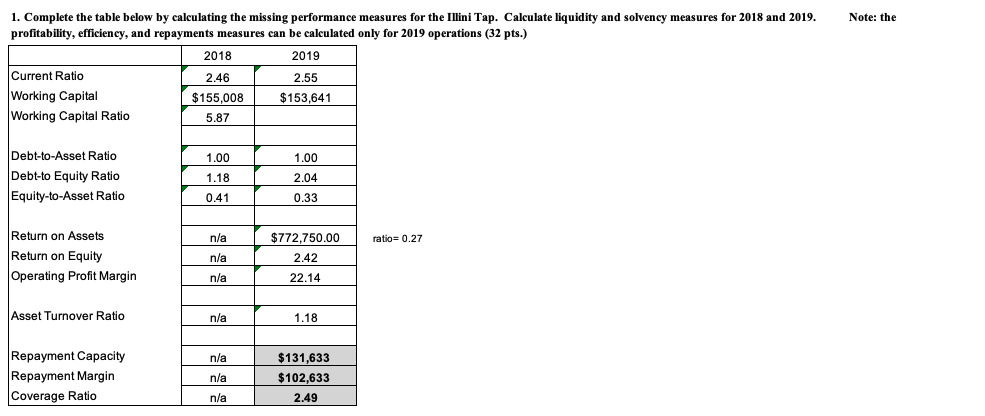
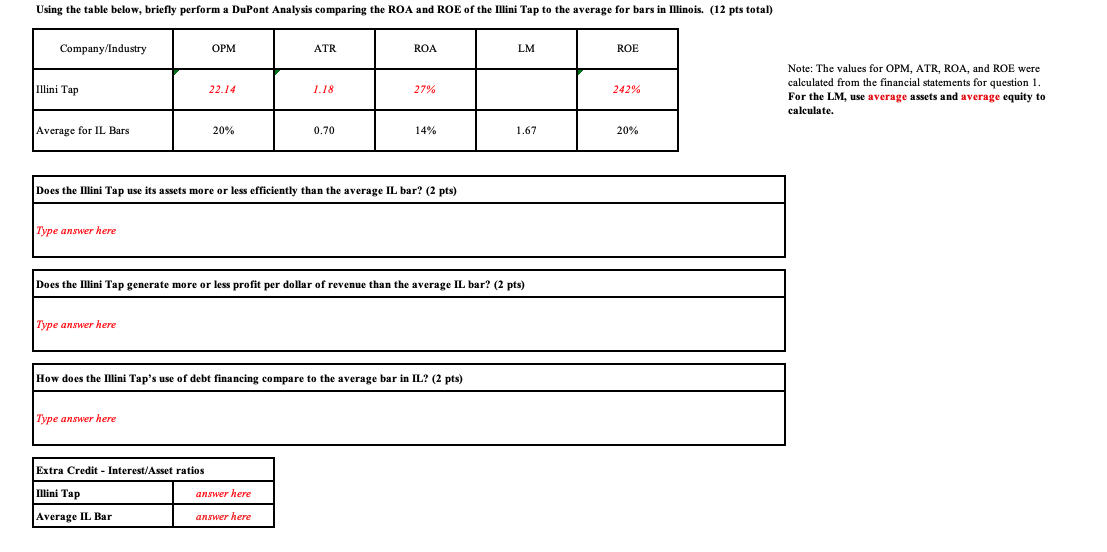
Note: the 2018 1. Complete the table below by calculating the missing performance measures for the Illini Tap. Calculate liquidity and solvency measures for 2018 and 2019. profitability, efficiency, and repayments measures can be calculated only for 2019 operations (32 pts.) 2019 Current Ratio 2.46 2.55 Working Capital $155,008 $153,641 Working Capital Ratio 5.87 1.00 Debt-to-Asset Ratio Debt-to Equity Ratio Equity-to-Asset Ratio 1.18 1.00 2.04 0.33 0.41 n/a ratio= 0.27 Return on Assets Return on Equity Operating Profit Margin $772,750.00 2.42 n/a nla 22.14 Asset Turnover Ratio nla 1.18 nla Repayment Capacity Repayment Margin Coverage Ratio n/a $131,633 $102,633 2.49 n/a Using the table below, briefly perform a DuPont Analysis comparing the ROA and ROE of the Mini Tap to the average for bars in Mlinois. (12 pts total) Company/Industry OPM ATR ROA LM ROE Illini Tap 22.14 1.18 27% 242% Note: The values for OPM, ATR, ROA, and ROE were calculated from the financial statements for question 1. For the LM, use average assets and average equity to calculate. Average for IL Bars 20% 0.70 14% 1.67 20% Does the Mini Tap use its assets more or less efficiently than the average IL bar? (2 pts) Type answer here Does the Mini Tap generate more or less profit per dollar of revenue than the average IL bar? (2 pts) Type answer here How does the Illini Tap's use of debt financing compare to the average bar in IL? (2 pts) Type answer here Extra Credit - Interest/Asset ratios Nini Tap answer here Average IL Bar answer here Note: the 2018 1. Complete the table below by calculating the missing performance measures for the Illini Tap. Calculate liquidity and solvency measures for 2018 and 2019. profitability, efficiency, and repayments measures can be calculated only for 2019 operations (32 pts.) 2019 Current Ratio 2.46 2.55 Working Capital $155,008 $153,641 Working Capital Ratio 5.87 1.00 Debt-to-Asset Ratio Debt-to Equity Ratio Equity-to-Asset Ratio 1.18 1.00 2.04 0.33 0.41 n/a ratio= 0.27 Return on Assets Return on Equity Operating Profit Margin $772,750.00 2.42 n/a nla 22.14 Asset Turnover Ratio nla 1.18 nla Repayment Capacity Repayment Margin Coverage Ratio n/a $131,633 $102,633 2.49 n/a Using the table below, briefly perform a DuPont Analysis comparing the ROA and ROE of the Mini Tap to the average for bars in Mlinois. (12 pts total) Company/Industry OPM ATR ROA LM ROE Illini Tap 22.14 1.18 27% 242% Note: The values for OPM, ATR, ROA, and ROE were calculated from the financial statements for question 1. For the LM, use average assets and average equity to calculate. Average for IL Bars 20% 0.70 14% 1.67 20% Does the Mini Tap use its assets more or less efficiently than the average IL bar? (2 pts) Type answer here Does the Mini Tap generate more or less profit per dollar of revenue than the average IL bar? (2 pts) Type answer here How does the Illini Tap's use of debt financing compare to the average bar in IL? (2 pts) Type answer here Extra Credit - Interest/Asset ratios Nini Tap answer here Average IL Bar answer here
Step by Step Solution
There are 3 Steps involved in it

Get step-by-step solutions from verified subject matter experts