

Question: Objective Determine the proper inventory stocking level to maximize long term profits. Background The owner of a sales kiosk of perishable goods downloaded 10 weeks
Objective
Determine the proper inventory stocking level to maximize long term profits.
Background
The owner of a sales kiosk of perishable goods downloaded 10 weeks of sales data from her POS (point of sales) system.
That appears below. The unit revenue is $65, the unit cost is $28, and any unsold inventory at the end of each day is sold on the secondary market at a salvage price of $9 per unit.
Restocking occurs on a daily basis. An inventory stockout on any given day sets the maximum revenue for that day, since replenishment orders cannot be placed for delivery on the same day.
The daily fixed cost of operation is $160.
Assignment
1. Develop a relative frequency table and histogram based on the 10-week sales data.
2. Develop a daily profit and loss (P&L) model for this kiosk owner.
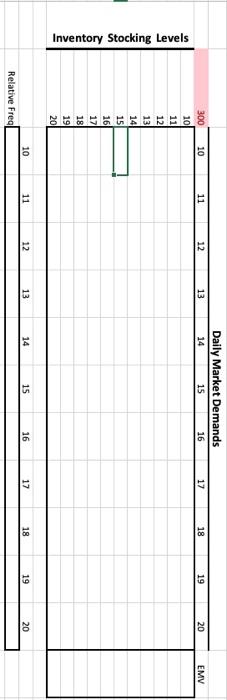
3. Based on the model, develop a two-way table (using the sensitivity tools) with the header row representing the customer demands and the header column representing inventory stocking decisions.
4. Compute the EMV (expected monetary values) for each inventory stocking level (decision alternative) based on your relative frequencies.
5. Determine the best decision based on the table results.
6. Using the goal seek tool, determine the minimum daily demand required to achieve breakeven with the given fixed cost.
How do i fill out the table? 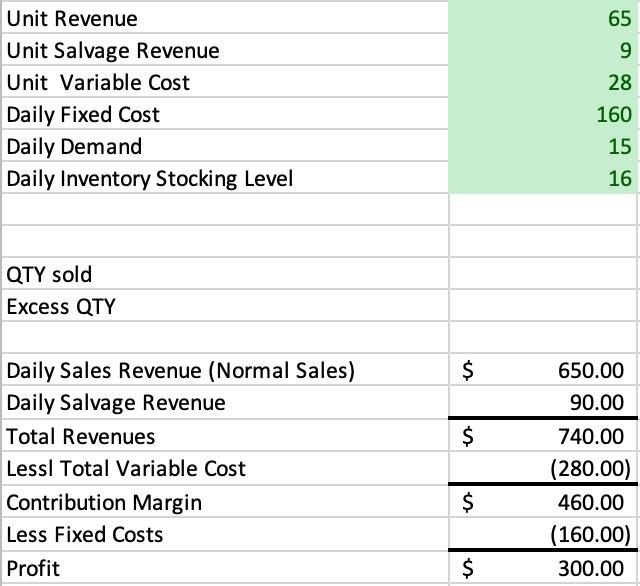
Step by Step Solution
There are 3 Steps involved in it
1 Expert Approved Answer
Step: 1 Unlock

Question Has Been Solved by an Expert!
Get step-by-step solutions from verified subject matter experts
Step: 2 Unlock
Step: 3 Unlock