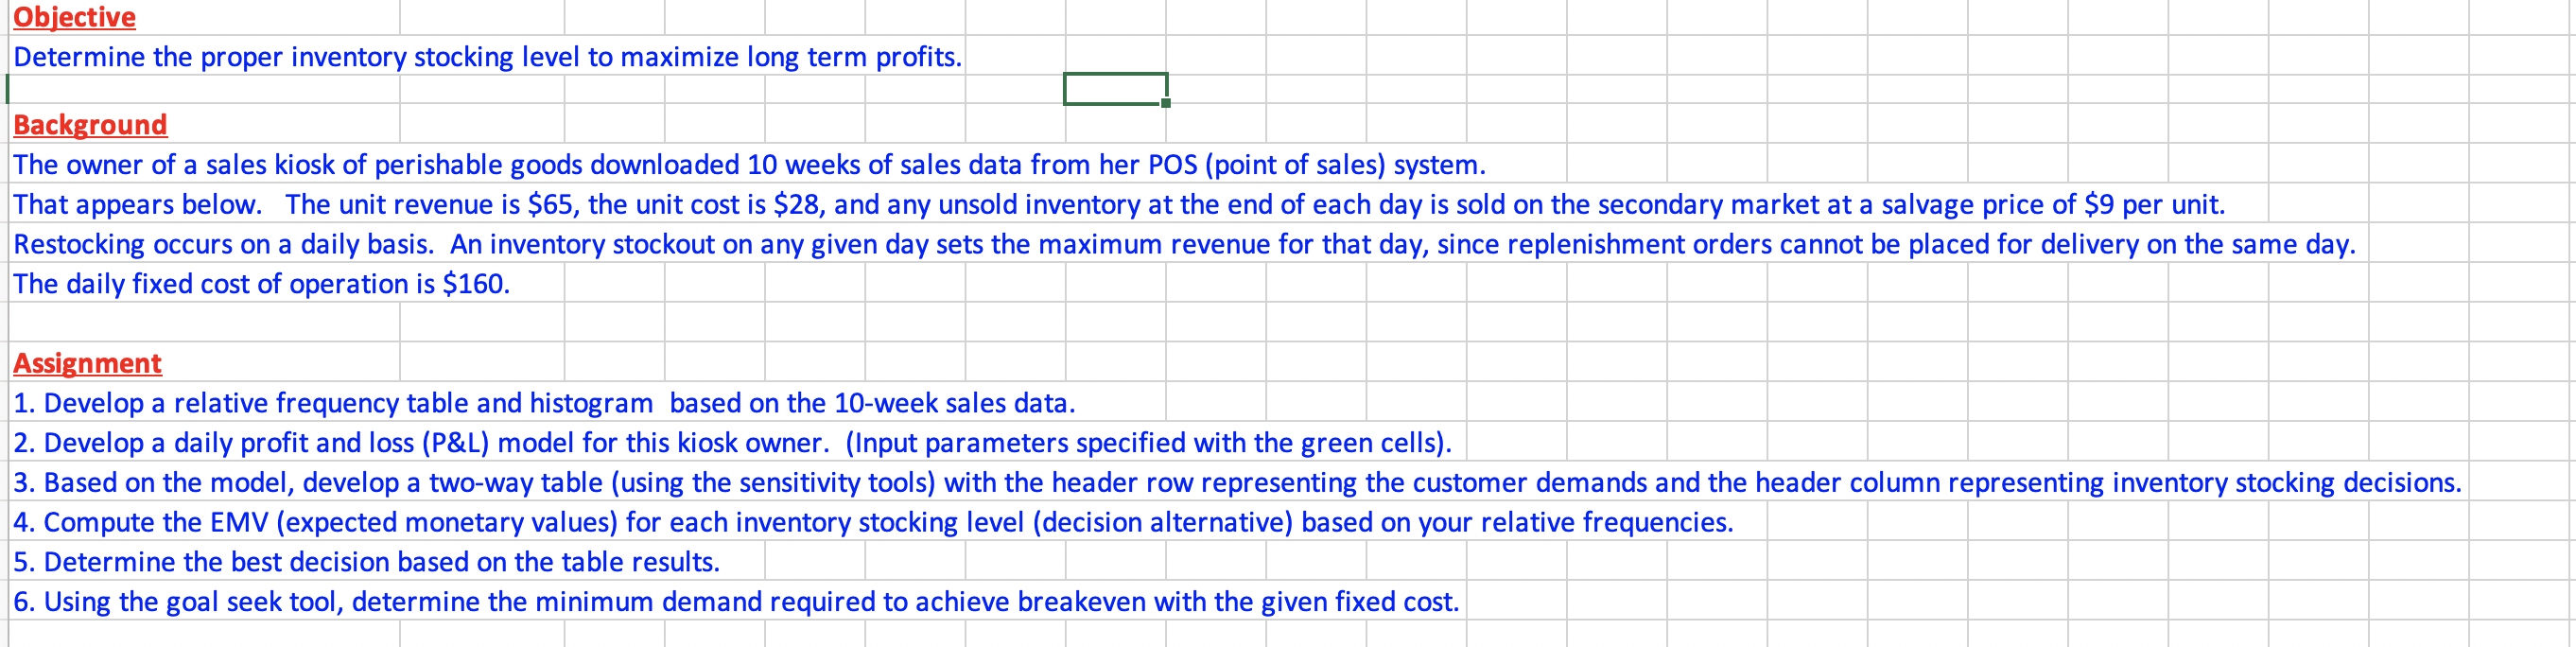
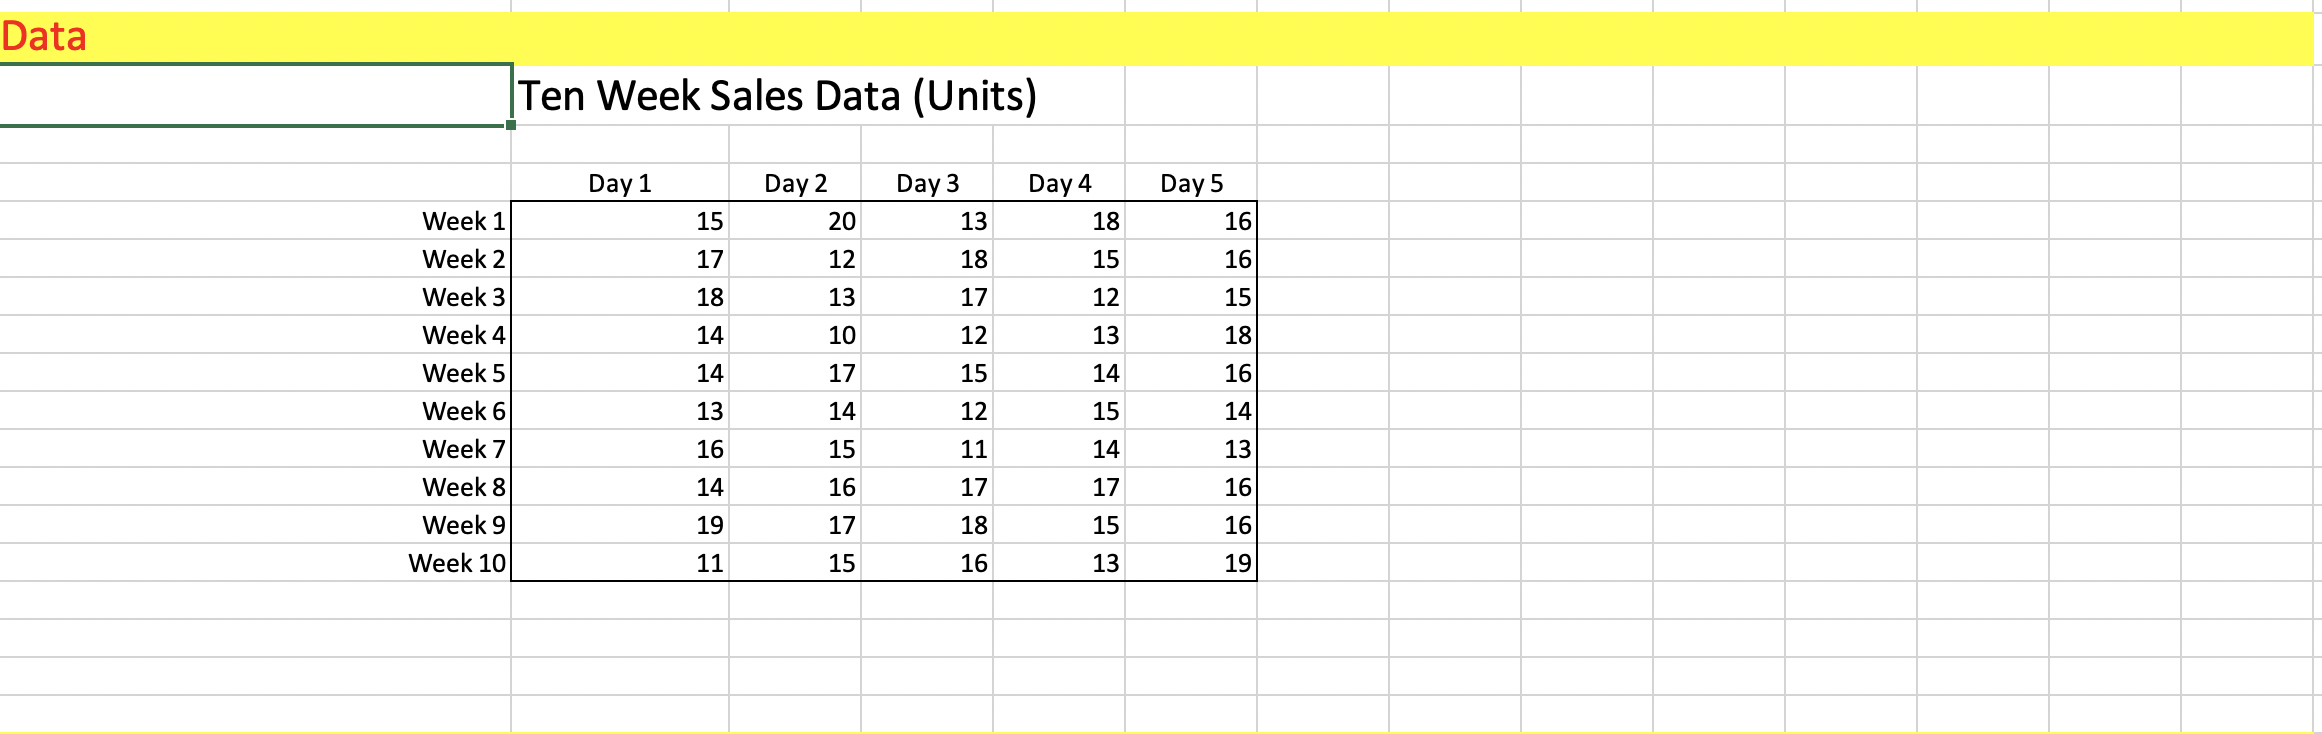
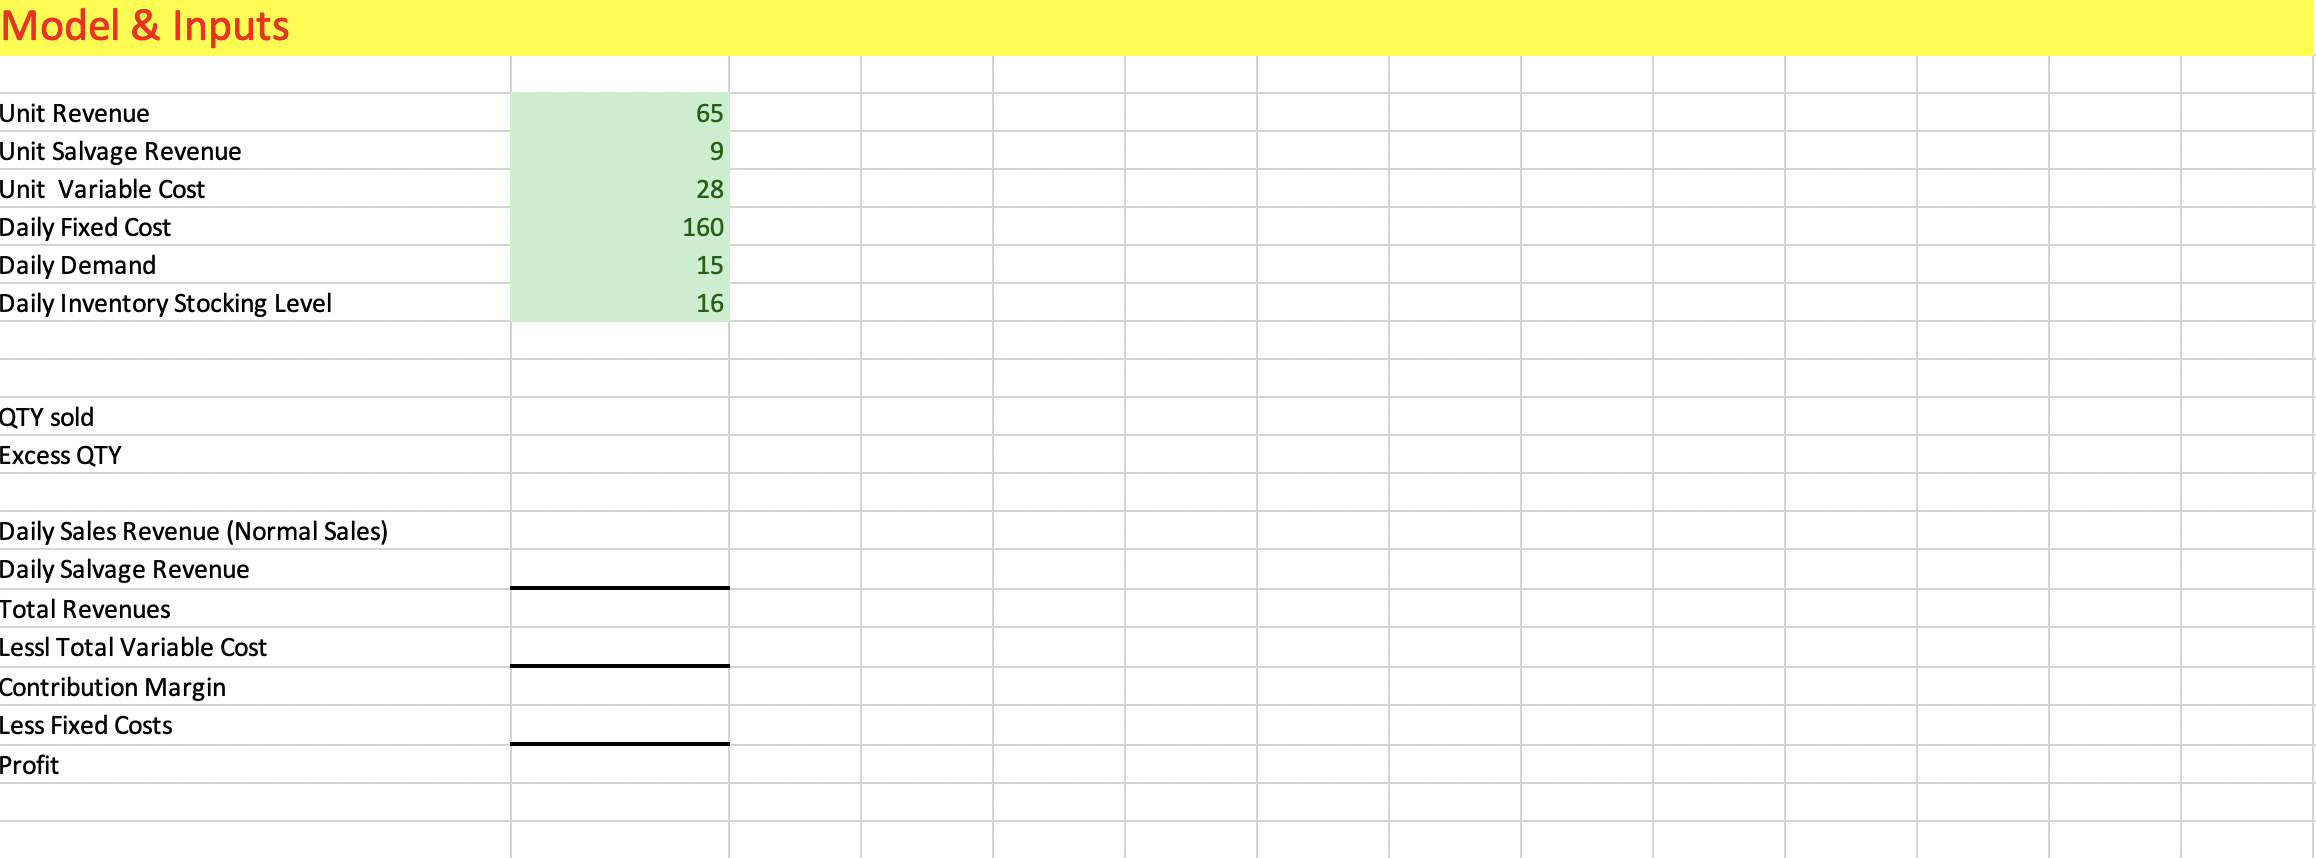
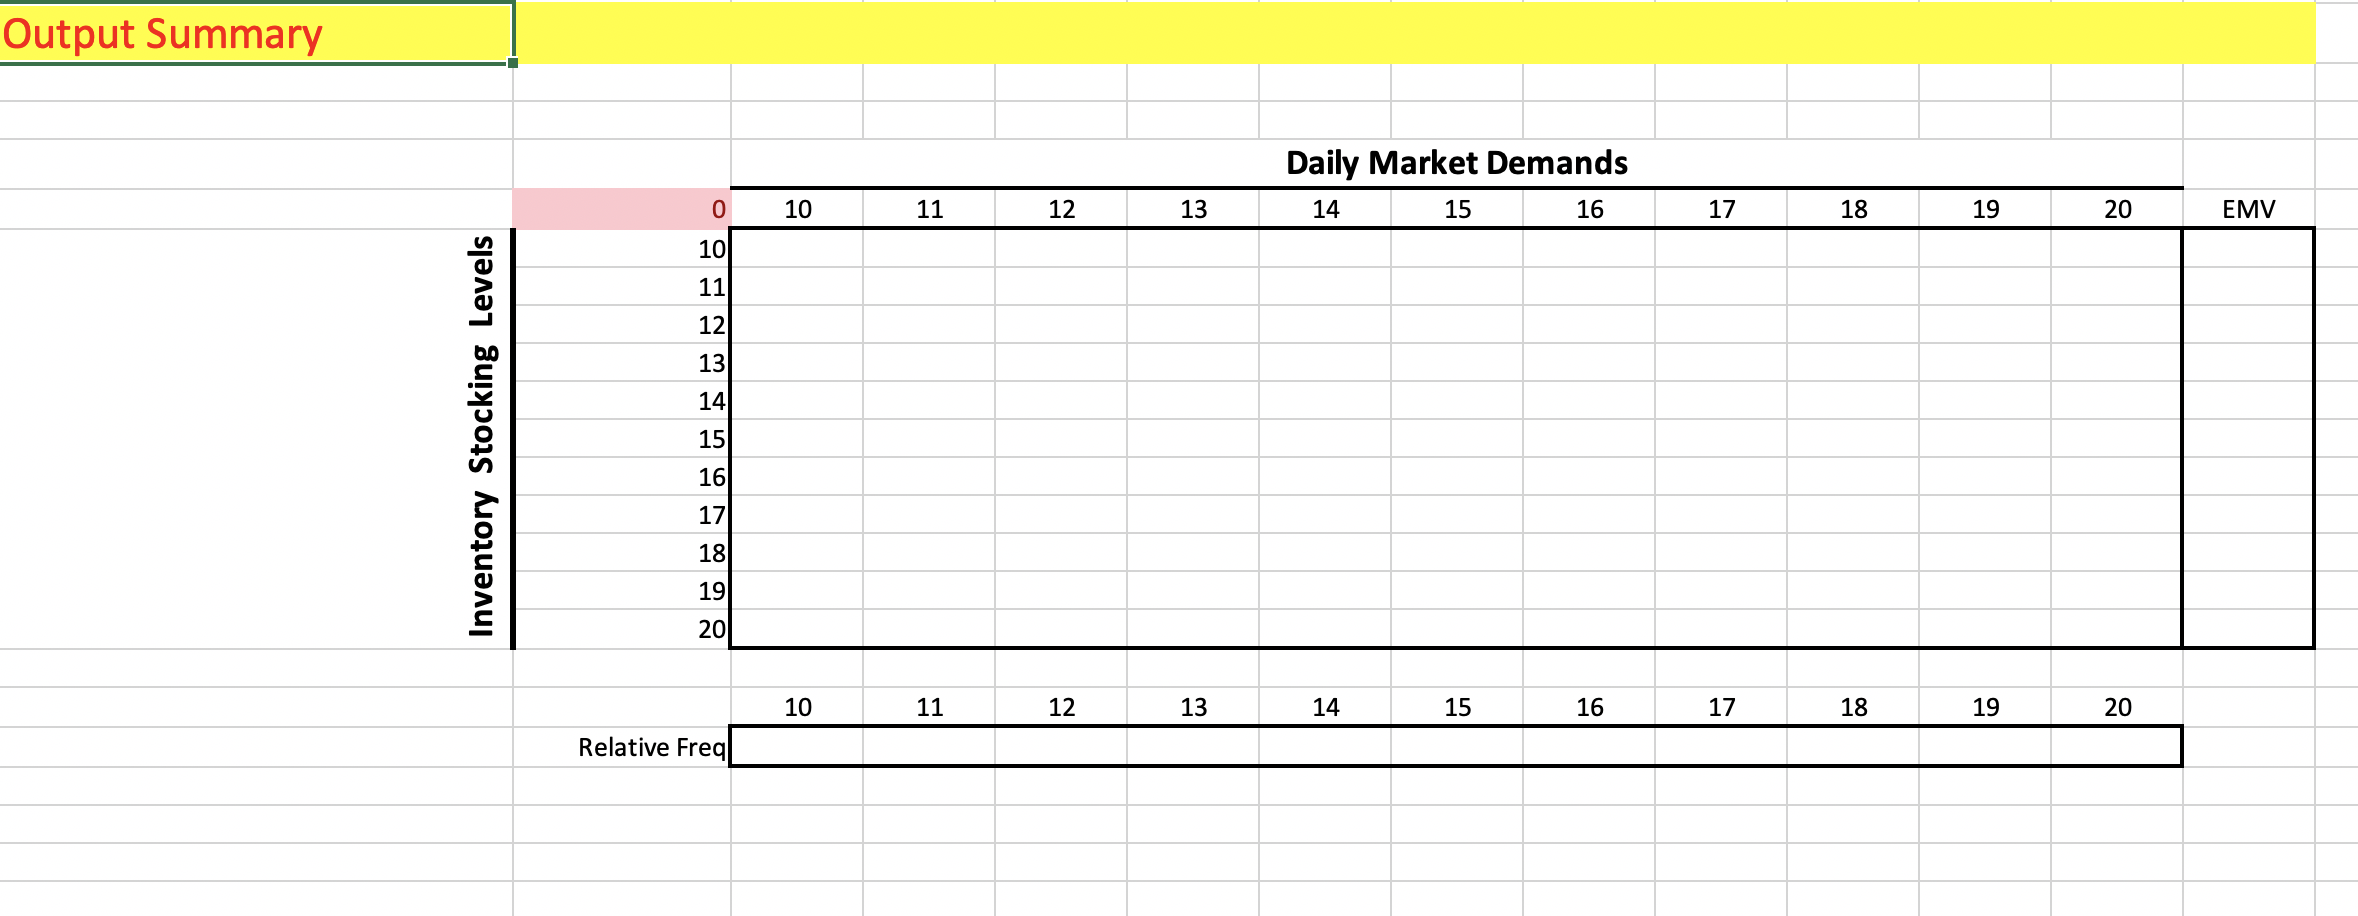
Question: Objective Determine the proper inventory stocking level to maximize long term profits. Background The owner of a sales kiosk of perishable goods downloaded 10 weeks

Objective Determine the proper inventory stockingObjective Determine the proper inventory stockingObjective Determine the proper inventory stockingObjective Determine the proper inventory stocking

Objective Determine the proper inventory stocking level to maximize long term profits. Background The owner of a sales kiosk of perishable goods downloaded 10 weeks of sales data from her POS (point of sales) system. That appears below. The unit revenue is $65, the unit cost is $28, and any unsold inventory at the end of each day is sold on the secondary market at a salvage price of $9 per unit. Restocking occurs on a daily basis. An inventory stockout on any given day sets the maximum revenue for that day, since replenishment orders cannot be placed for delivery on the same day. The daily fixed cost of operation is $160. Assignment 1. Develop a relative frequency table and histogram based on the 10-week sales data. 2. Develop a daily profit and loss (P&L) model for this kiosk owner. (Input parameters specified with the green cells). 3. Based on the model, develop a two-way table (using the sensitivity tools) with the header row representing the customer demands and the header column representing inventory stocking decisions. 4. Compute the EMV (expected monetary values) for each inventory stocking level (decision alternative) based on your relative frequencies. 5. Determine the best decision based on the table results. 6. Using the goal seek tool, determine the minimum demand required to achieve breakeven with the given fixed cost. Data Ten Week Sales Data (Units) Day 1 Day 2 20 Day 3 13 Day 4 18 Day 5 16 15 17 12 18 15 16 Week 1 Week 2 Week 3 Week 4 18 13 17 12 15 14 10 12 13 18 14 17 15 14 16 13 14 12 15 14 16 15 11 14 13 Week 5 Week 6 Week 7 Week 8 Week 9 Week 10 14 16 17 17 16 19 17 18 15 16 11 15 16 13 19 Model & Inputs 65 9 28 Unit Revenue Unit Salvage Revenue Unit Variable Cost Daily Fixed Cost Daily Demand Daily Inventory Stocking Level 160 15 16 QTY sold Excess QTY Daily Sales Revenue (Normal Sales) Daily Salvage Revenue Total Revenues Lessl Total Variable Cost Contribution Margin Less Fixed Costs Profit Output Summary Daily Market Demands 0 10 11 12 13 14 15 16 17 18 19 20 EMV 10 11 12 13 14 Inventory Stocking Levels 15 16 17 18 19 20 10 11 12 13 14 15 16 17 18 19 20 Relative Freq Objective Determine the proper inventory stocking level to maximize long term profits. Background The owner of a sales kiosk of perishable goods downloaded 10 weeks of sales data from her POS (point of sales) system. That appears below. The unit revenue is $65, the unit cost is $28, and any unsold inventory at the end of each day is sold on the secondary market at a salvage price of $9 per unit. Restocking occurs on a daily basis. An inventory stockout on any given day sets the maximum revenue for that day, since replenishment orders cannot be placed for delivery on the same day. The daily fixed cost of operation is $160. Assignment 1. Develop a relative frequency table and histogram based on the 10-week sales data. 2. Develop a daily profit and loss (P&L) model for this kiosk owner. (Input parameters specified with the green cells). 3. Based on the model, develop a two-way table (using the sensitivity tools) with the header row representing the customer demands and the header column representing inventory stocking decisions. 4. Compute the EMV (expected monetary values) for each inventory stocking level (decision alternative) based on your relative frequencies. 5. Determine the best decision based on the table results. 6. Using the goal seek tool, determine the minimum demand required to achieve breakeven with the given fixed cost. Data Ten Week Sales Data (Units) Day 1 Day 2 20 Day 3 13 Day 4 18 Day 5 16 15 17 12 18 15 16 Week 1 Week 2 Week 3 Week 4 18 13 17 12 15 14 10 12 13 18 14 17 15 14 16 13 14 12 15 14 16 15 11 14 13 Week 5 Week 6 Week 7 Week 8 Week 9 Week 10 14 16 17 17 16 19 17 18 15 16 11 15 16 13 19 Model & Inputs 65 9 28 Unit Revenue Unit Salvage Revenue Unit Variable Cost Daily Fixed Cost Daily Demand Daily Inventory Stocking Level 160 15 16 QTY sold Excess QTY Daily Sales Revenue (Normal Sales) Daily Salvage Revenue Total Revenues Lessl Total Variable Cost Contribution Margin Less Fixed Costs Profit Output Summary Daily Market Demands 0 10 11 12 13 14 15 16 17 18 19 20 EMV 10 11 12 13 14 Inventory Stocking Levels 15 16 17 18 19 20 10 11 12 13 14 15 16 17 18 19 20 Relative Fre

Step by Step Solution

There are 3 Steps involved in it

1 Expert Approved Answer
Step: 1 Unlock blur-text-image
Question Has Been Solved by an Expert!

Get step-by-step solutions from verified subject matter experts

Step: 2 Unlock
Step: 3 Unlock

Students Have Also Explored These Related General Management Questions!